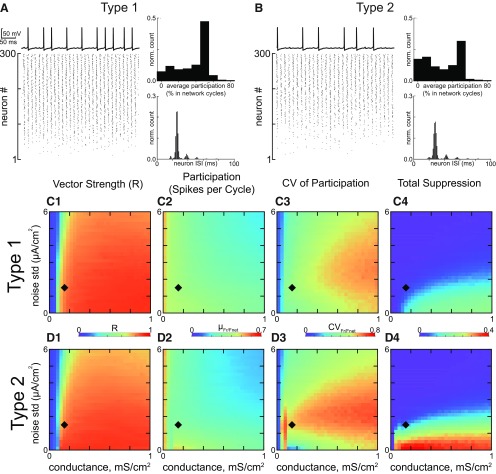
Figure 5.
Steady state synchronization of heterogeneous inhibitory interneuronal networks with shunting inhibition. A, Networks of type 1 neurons with synaptic conductance 1.5 mS/cm2 and noise SD 1.5 µA/cm2, indicated by black diamonds in C, D. Bottom left, Raster plot for 300 neurons, ordered by the level of applied depolarizing bias current, with the most depolarized neurons at the top. Top left, Representative membrane potential trace for an individual neuron that clearly exhibits a subthreshold oscillation due to network activity and cycle skipping. Bottom right, Histogram of ISIs across the population. Top right, Histogram of average participation for all neurons in the network. B, Networks of type 2 neurons with the same parameters as in A. The four panels are the same as in A. C, 2D parameter sweep in conductance strength and noise SD for type 1 networks. Heatmaps from left to right give (C1) the vector strength R of synchronization of individual spikes with the network oscillation; (C2) the average participation for neurons that are not totally suppressed calculated as the mean µFr/Fnet of the frequency of spiking neurons normalized by the population frequency; (C3) the CV of the participation CVFr/Fnet; and (C4) the fraction of completely suppressed neurons. D, 2D parameter sweep for type 2 networks. Heatmaps are the same as in C.

