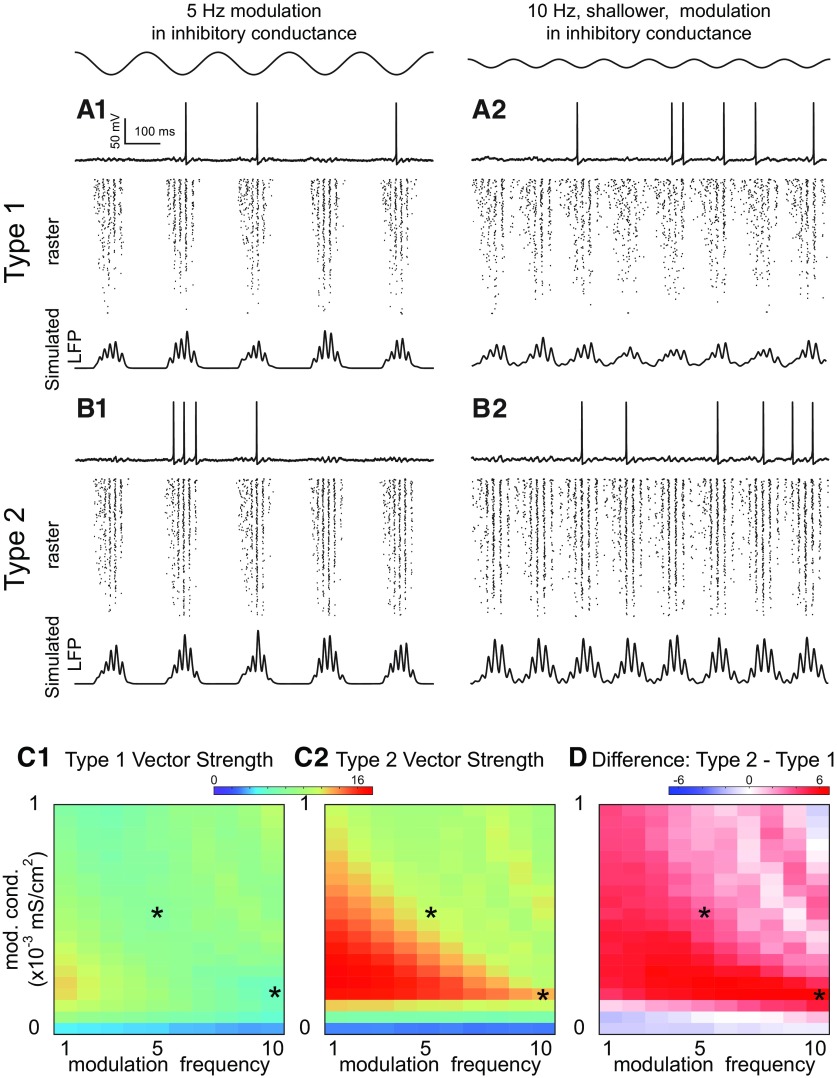
Figure 7.
Theta phase γ amplitude modulation of heterogeneous inhibitory interneuronal networks with hyperpolarizing inhibition. Two examples of sinusoidal modulation of these networks, with a 5-Hz sinusoidal modulation in inhibitory conductance shown at top left and a shallower 10-Hz sinusoidal modulation shown at top right (conductance , noise SD ). A, Type 1 networks. A1, Five-Hertz modulation. A2, Ten-Hertz modulation. Top, Representative sparsely firing single neuron type 1 traces with subthreshold oscillations due to network activity. Middle, Raster plots for 300 neurons with faster neurons (based on I app) shown at the top. Bottom, Simulated LFP consisting of summated inhibitory currents throughout the network. B, Type 2 networks. B1, Five-Hertz modulation. B2, Ten-Hertz modulation. Top, Representative sparsely firing single neuron type 2 traces with subthreshold oscillations due to network activity. Middle, Raster plots for 300 neurons with faster neurons (based on I app) shown at the top. Bottom, Simulated LFP consisting of summated inhibitory currents throughout the network. C, Heatmaps for 2D parameter space of modulation depth (given in terms of the peak of the sinusoidal conductance waveform) and frequency. Asterisks show parameter values from A, B. C1, Vector strengths for type 1 networks. C2, Vector strengths for type 2 networks. C3, Difference of vector strengths for type 2 and type 1 networks. Hot colors indicate a difference greater than zero. The difference is well above zero in the lower left-hand corner plot meaning that the vector strength for type 2 networks is higher.

