
Figure 1.
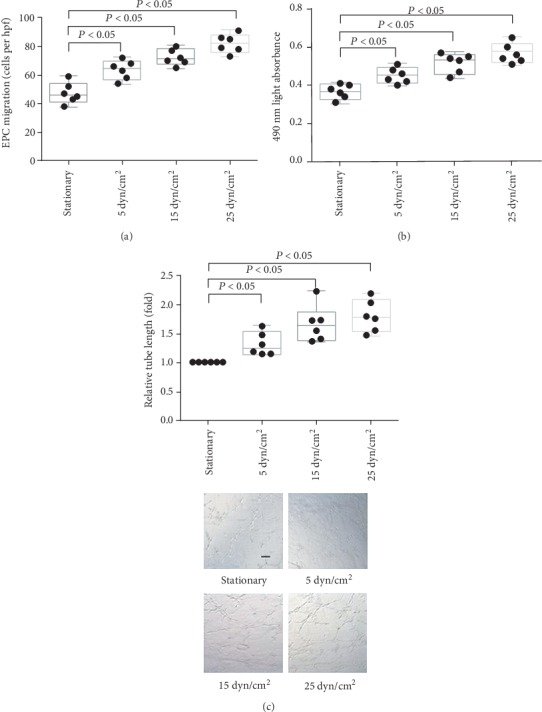
The effect of different levels of LSS on in vitro function of late EPCs. (a) Quantification analysis of VEGF-induced migration of late EPCs (∗P < 0.05 vs. EPCs under static condition group, n = 6 per group). (b) Quantification analysis of proliferative activity of late EPCs (∗P < 0.05 vs. EPCs under static condition group, n = 6 per group). (c) Quantification analysis and representative photograph tube information of late EPCs (represented as relative value to EPCs under static condition group, ∗P < 0.05 vs. EPCs under static condition group, n = 6 per group). Scale bar 200 μm. Least significant difference was applied for the post hoc test in statistical analysis. hpf = high power field.