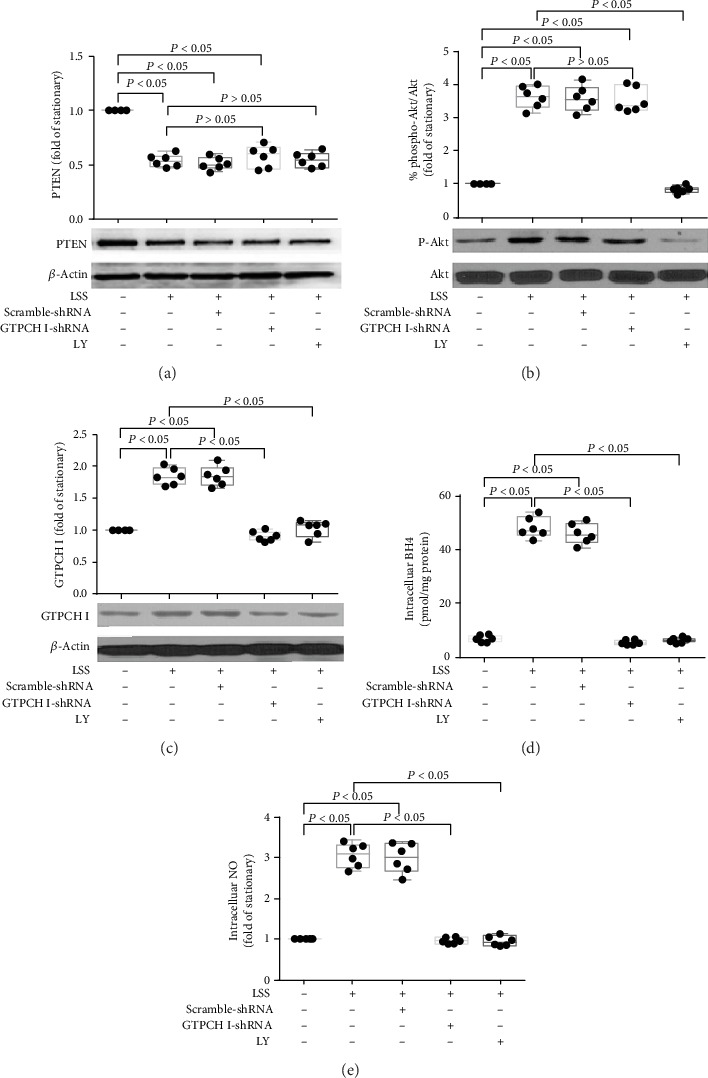
Figure 4.

The relationship between PTEN/Akt and GTPCHI/BH4 pathway in EPCs in response to LSS. (a) Representative photograph and quantitative analysis of the effects of Akt inhibition or GTPCH I knockdown on LSS-regulated PTEN protein expression in late EPCs (∗P < 0.05 vs. EPCs under static condition group, n = 6; NS: no significant difference vs. LSS+EPC group, n = 6 per group). (b) Representative photograph and quantitative analysis of the effects of Akt inhibition or GTPCH I knockdown on LSS-regulated Akt phosphorylation of EPCs in late EPCs (∗P < 0.05 vs. EPCs under static condition group, n = 6; NS: no significant difference vs. LSS+EPC group, n = 6 per group). (c) Representative photograph and quantitative analysis of the effects of Akt inhibition or GTPCH I knockdown on LSS-regulated GTPCH I protein expression in late EPCs (∗P < 0.05 vs. EPCs under static condition group, n = 6; #P < 0.05 vs. LSS+EPC group, n = 6 per group). (d, e) Quantitative analyses of the effects of Akt inhibition or GTPCH I knockdown on LSS-regulated intracellular BH4 (d) and NO (e) levels in late EPCs (∗P < 0.05 vs. EPCs under static condition group, n = 6; #P < 0.05 vs. LSS+EPC group, n = 6 per group). Least significant difference was applied for the post hoc test in statistical analysis. Concentration of LY 294002: 10 μmol/l. LSS = laminar shear stress.
