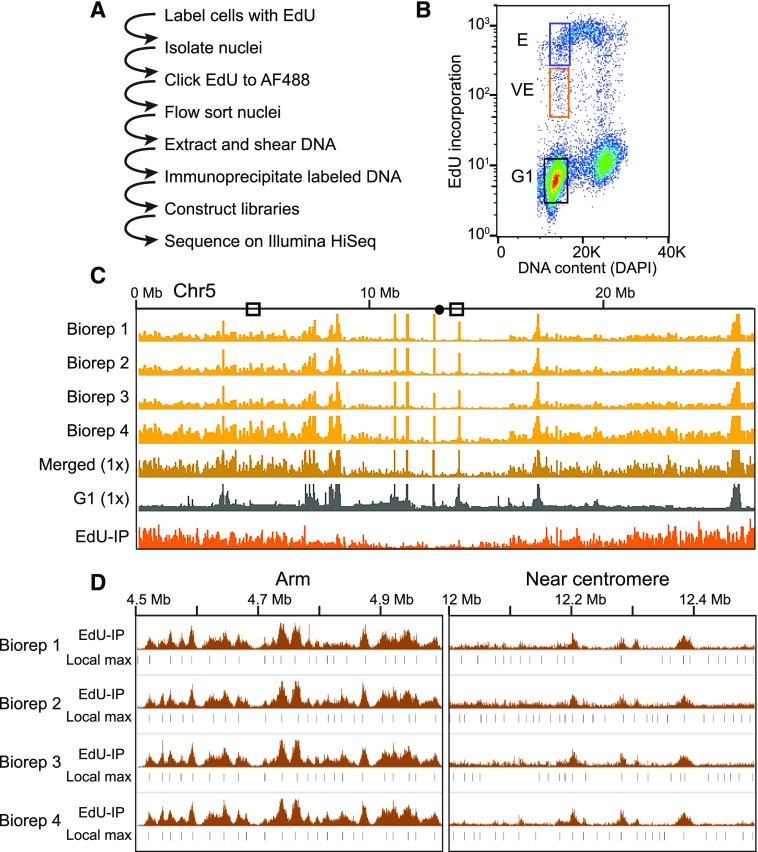
Figure 1.
Experimental strategy and flow sorting. A, Outline of EdU-seq protocol. B, Bivariate flow cytometry profile of nuclei sorted by EdU incorporation (measured by AF488 fluorescence, y axis) and DNA content (measured by DAPI fluorescence, x axis), including sorting gates used to define the G1 (black box), VE (orange box), and E (blue box) populations. C, Browser profiles of VE signal from four independent biological replicates (Biorep) across Chromosome 5 (gold tracks, scale 0–100 read density signal) illustrating the reproducibility between replicates. The merged read data normalized to 1× genome coverage (dark gold), the G1 control (gray), and the final “sequenceability” normalized file (orange) are also shown (scales 0–5 normalized signal ratio). D, Reproducibility of local maxima (Local max) across replicates. The 1× “sequenceability” normalized data, which we designate as EdU-IP (scale = 0–5 normalized signal ratio), and the local maxima are shown for each replicate.

