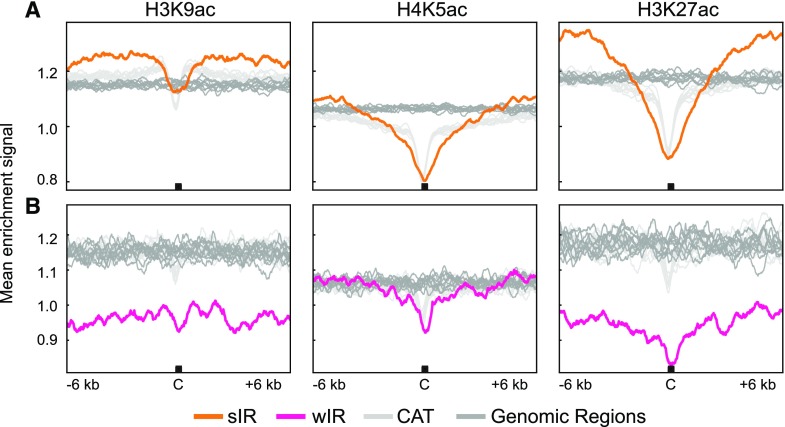
Figure 5.
Mean analysis of selected acetylated histones at IRs. A, Mean enrichment signal for H3K9ac (left), H4K5ac (center), and H3K27ac (right) at and around sIR-Cs (orange), 10 random genomic datasets (dark gray), and 10 CAT datasets (light gray) regions. B, Mean enrichment signal for each acetylated histone at and around the wIR-Cs (pink), 10 random genomic datasets (dark gray), and 10 CAT datasets (light gray) regions. The plots are ±6-kb windows around the IR-Cs with the C marking the center. The mean was calculated in 20-bp bins.

