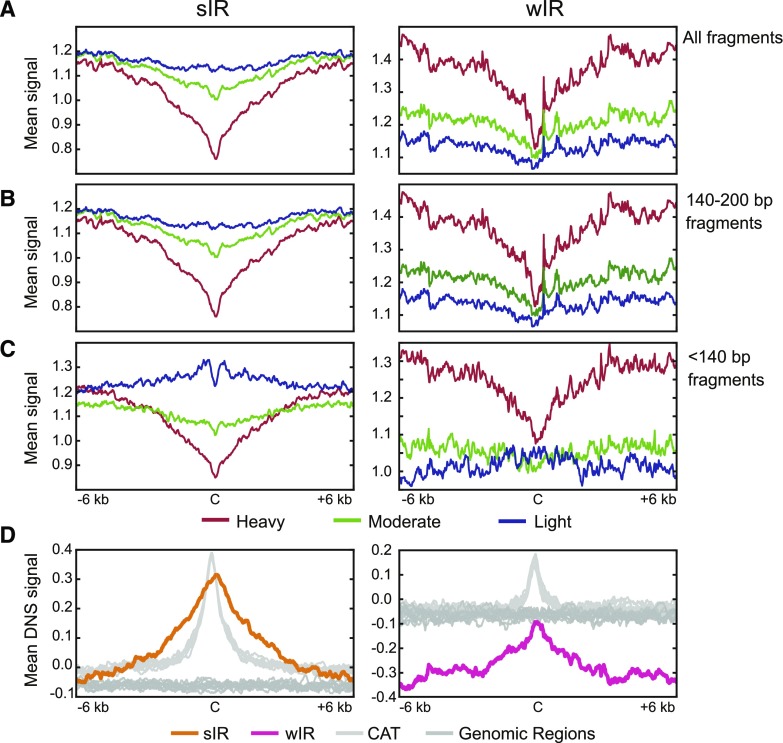
Figure 6.
Mean analysis comparing heavy, moderate, and light MNase digestions by fragment size. A, Mean heavy (red), moderate (green), and light (blue) digestion profiles at and around sIR-Cs (left) and wIR-Cs (right). B, Mean digestion plots comprising only 140- to 200-bp fragments. Plots in (A) and (B) look similar; however, Supplemental Figure S9 shows they are not identical. C, Mean digestion plots comprising only fragments less than 140 bp. D, Mean differential nuclease sensitivity (DNS) signal at and around sIR-Cs (left, orange line) and wIR-Cs (right, pink line) and their random genomic regions (dark gray) and CAT regions (light gray). DNS signal is the difference between the light digestion signal and the heavy digestion signal (scale −2 to 2), where positive values represent more open chromatin than negative values. The mean was calculated in 20-bp bins, and the plots are of ±6-kb windows around the IR-Cs with the C marking the center.

