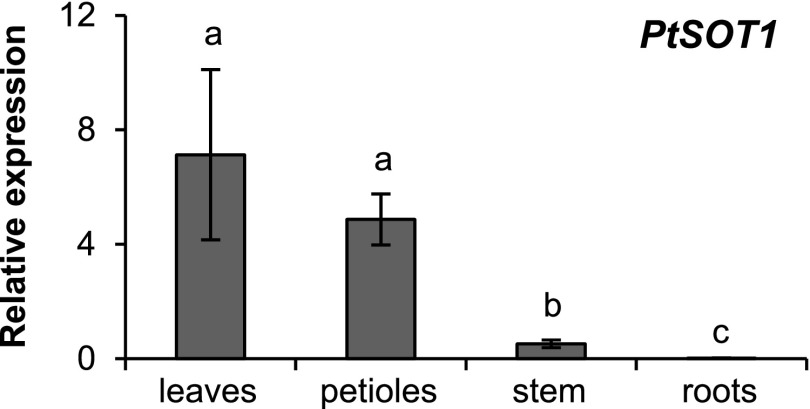
Figure 7.
Gene expression analysis of PtSOT1. Transcript accumulation of PtSOT1 in different organs of P. trichocarpa was measured using RT-qPCR. Means and se are shown (n = 6). Leaf blades (leaves) and petioles originated from LPI3 to LPI10 leaves. Stem material was harvested between LPI3 and LPI10 leaves. HIS was used as a housekeeping gene (Wang et al., 2014a). Differences between organs were analyzed by a one-way repeated measures ANOVA and a posthoc test (Tukey’s test). Different letters indicate significant differences (P < 0.05).

