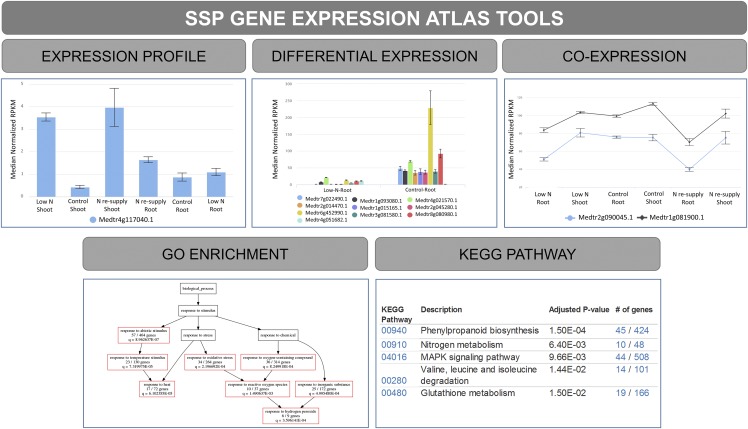
Figure 5.
Available tools in the SSP-GEA showing different outputs. The top shows bar charts displaying the results of the expression profile analysis of Medtr4g117040.1 transcript for different nitrogen levels in shoots and roots (left) and the DE analysis for nitrogen levels in roots (middle; low nitrogen levels and full nutrition control; adjusted P < 0.1). A line chart is displayed as a result of the coexpression analysis of the gene Medtr6g452990 for nitrogen levels in shoots and roots (right; low nitrogen levels, full nutrition control, and nitrogen resupply). The lower left shows a directed acyclic graph as a result of the GO enrichment analysis from five top GO terms from genes differentially expressed for different nitrogen levels in roots. The lower right shows a table with five top significantly (q < 0.05) enriched KEGG pathways from genes differentially expressed for nitrogen levels in roots.

