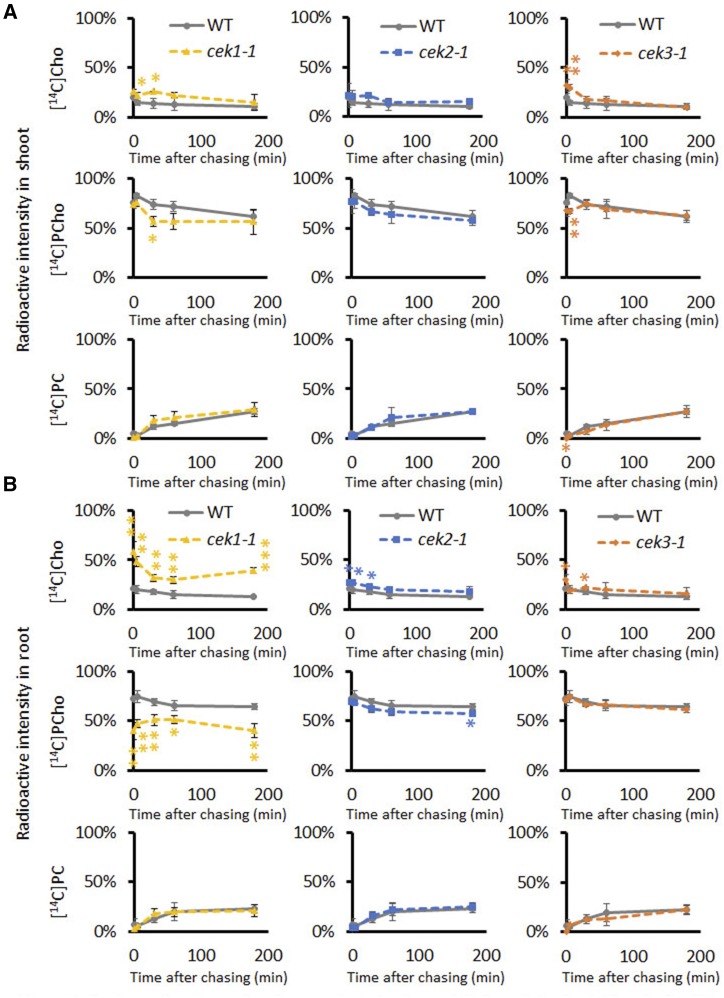
Figure 3.
In vivo radioactive pulse-chase analysis for the metabolism of Cho in the shoots (A) and roots (B) of cek1-1, cek2-1, and cek3-1 mutants. Fourteen-day-old wild-type (WT; gray lines), cek1-1 (yellow lines), cek2-1 (blue lines), and cek3-1 (orange lines) seedlings were labeled with [14C]Cho for 10 min and the amounts of [14C]Cho, [14C]PCho, and [14C]PC were measured at 0, 5, 30, 60, and 180 min after chasing. Ratios of [14C]Cho, [14C]PCho, and [14C]PC are shown as percentages of radioactive intensities quantified. Note that wild-type plots are in triplicate in each graph for clarity in displaying profiles in each cek mutant. Data are means ± sd from three biological replicates. Asterisks indicate statistical significance determined by Student’s t test: *P < 0.05; **P < 0.01 and ***P < 0.001.

