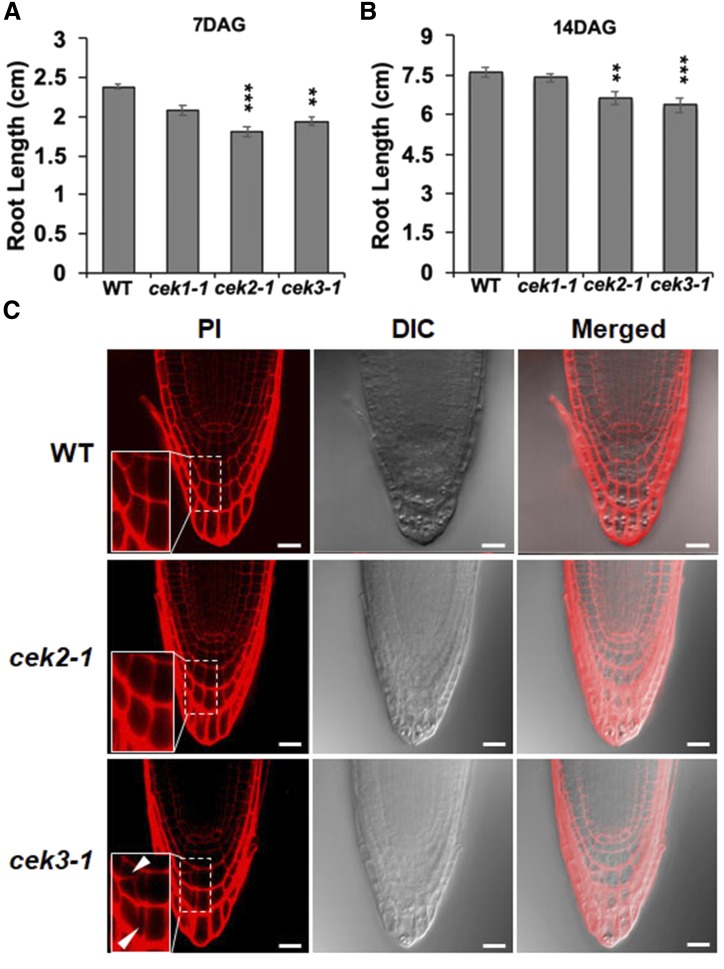
Figure 7.
Root development in the seedlings of cek2-1 and cek3-1 mutants. A and B, Measurement of root length at 7 (A) and 14 (B) DAG. Data are means ± se of three biological replicates (n > 25). Asterisks indicate statistical significance by Student’s t test: **P < 0.01 and ***P < 0.001. C, Cellular architecture of root tips in 7-DAG wild-type, cek2-1, and cek3-1 seedlings as detected by PI stain. Inset pictures are magnified images of the columella cells in the dashed rectangle. White arrows indicate abnormally shaped columella cells. Scale bars = 20 µm. DIC, Differential interference contrast.

