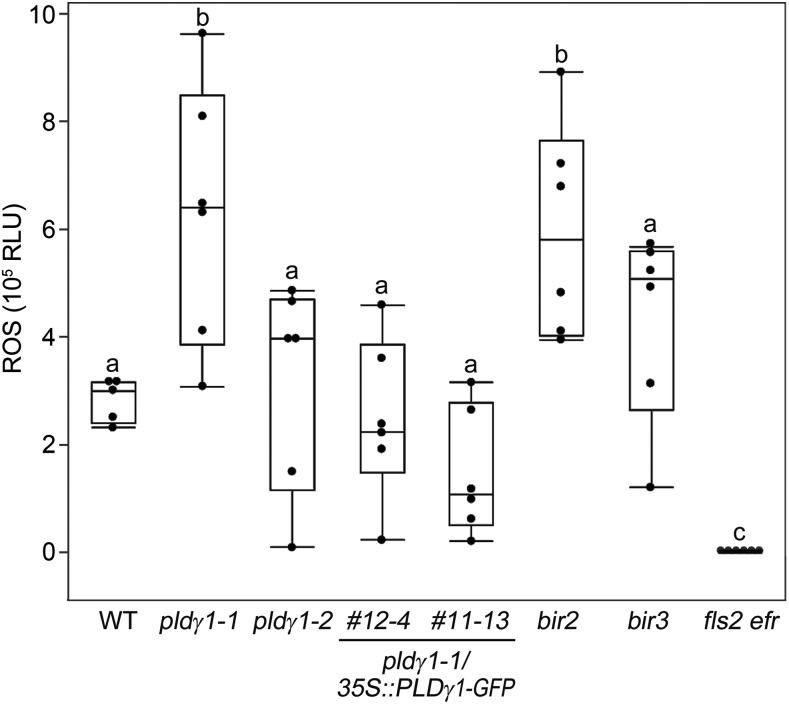
Figure 3.
ROS levels are affected in pldγ1-1 mutants. Arabidopsis leaf pieces of the indicated mutant line were treated with 1 μm flg22 or water as a control, and ROS production was monitored over time. Shown are relative light units (RLU). Box plots show the minimum, first quartile, median, third quartile, and a maximum of peak values minus background values (n = 6). Water-treated samples had no detectable ROS production and are therefore not displayed in the figure. Lowercase letters indicate homogenous groups according to post hoc comparisons following one-way ANOVA (Dunnet’s multiple comparison analysis with the wild type [WT] as a control at a probability level of P < 0.05). The experiment was performed at least three times and one representative result is shown.

