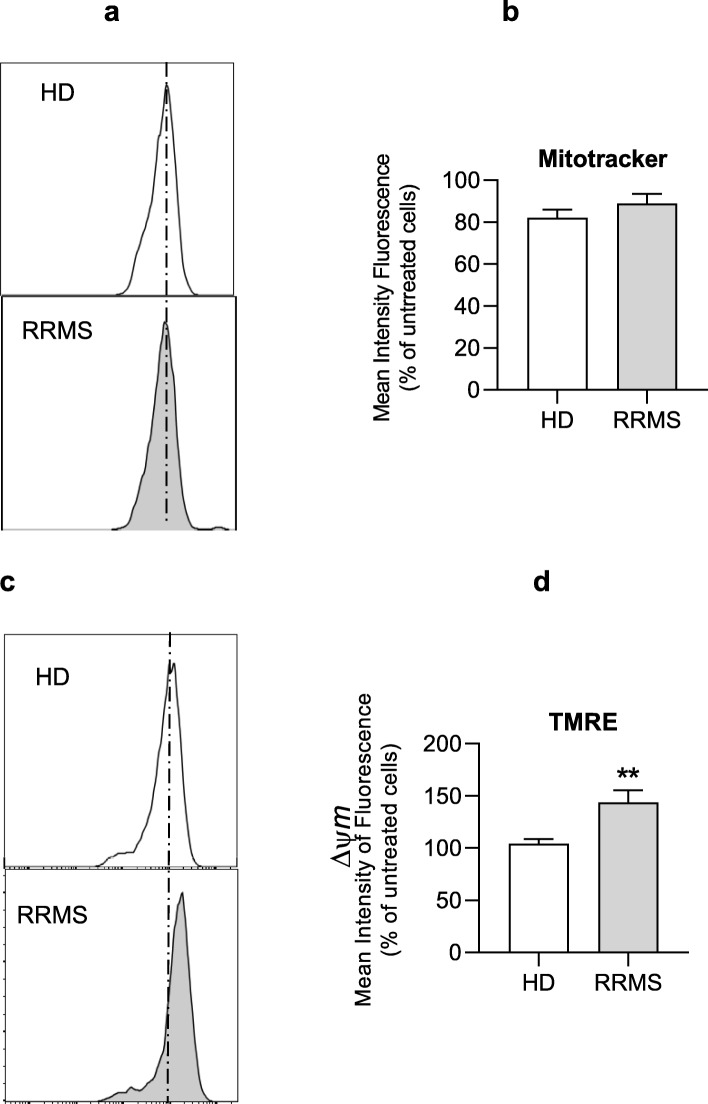
Fig. 6.
Impact of RRMS sera treatment on the mitochondria content and membrane potential in brain ECs. (a, b) Representative flow cytometry plots and cumulative graphs of mitotracker green staining in hCMEC/D3 cells treated with 20% RRMS sera or HD for 16 h. (c, d) Representative flow cytometry plots and cumulative graphs of TMRE staining showing membrane potential in hCMEC/D3 treated with RRMS or HD sera. Data are expressed as mean ± s.e.m. of 30 donors/group (pooled in pairs matched in sex, age and EDSS score for RRMS patients). Statistical analysis by Mann-Whitney U test (two-tails) **P ≤ 0.01

