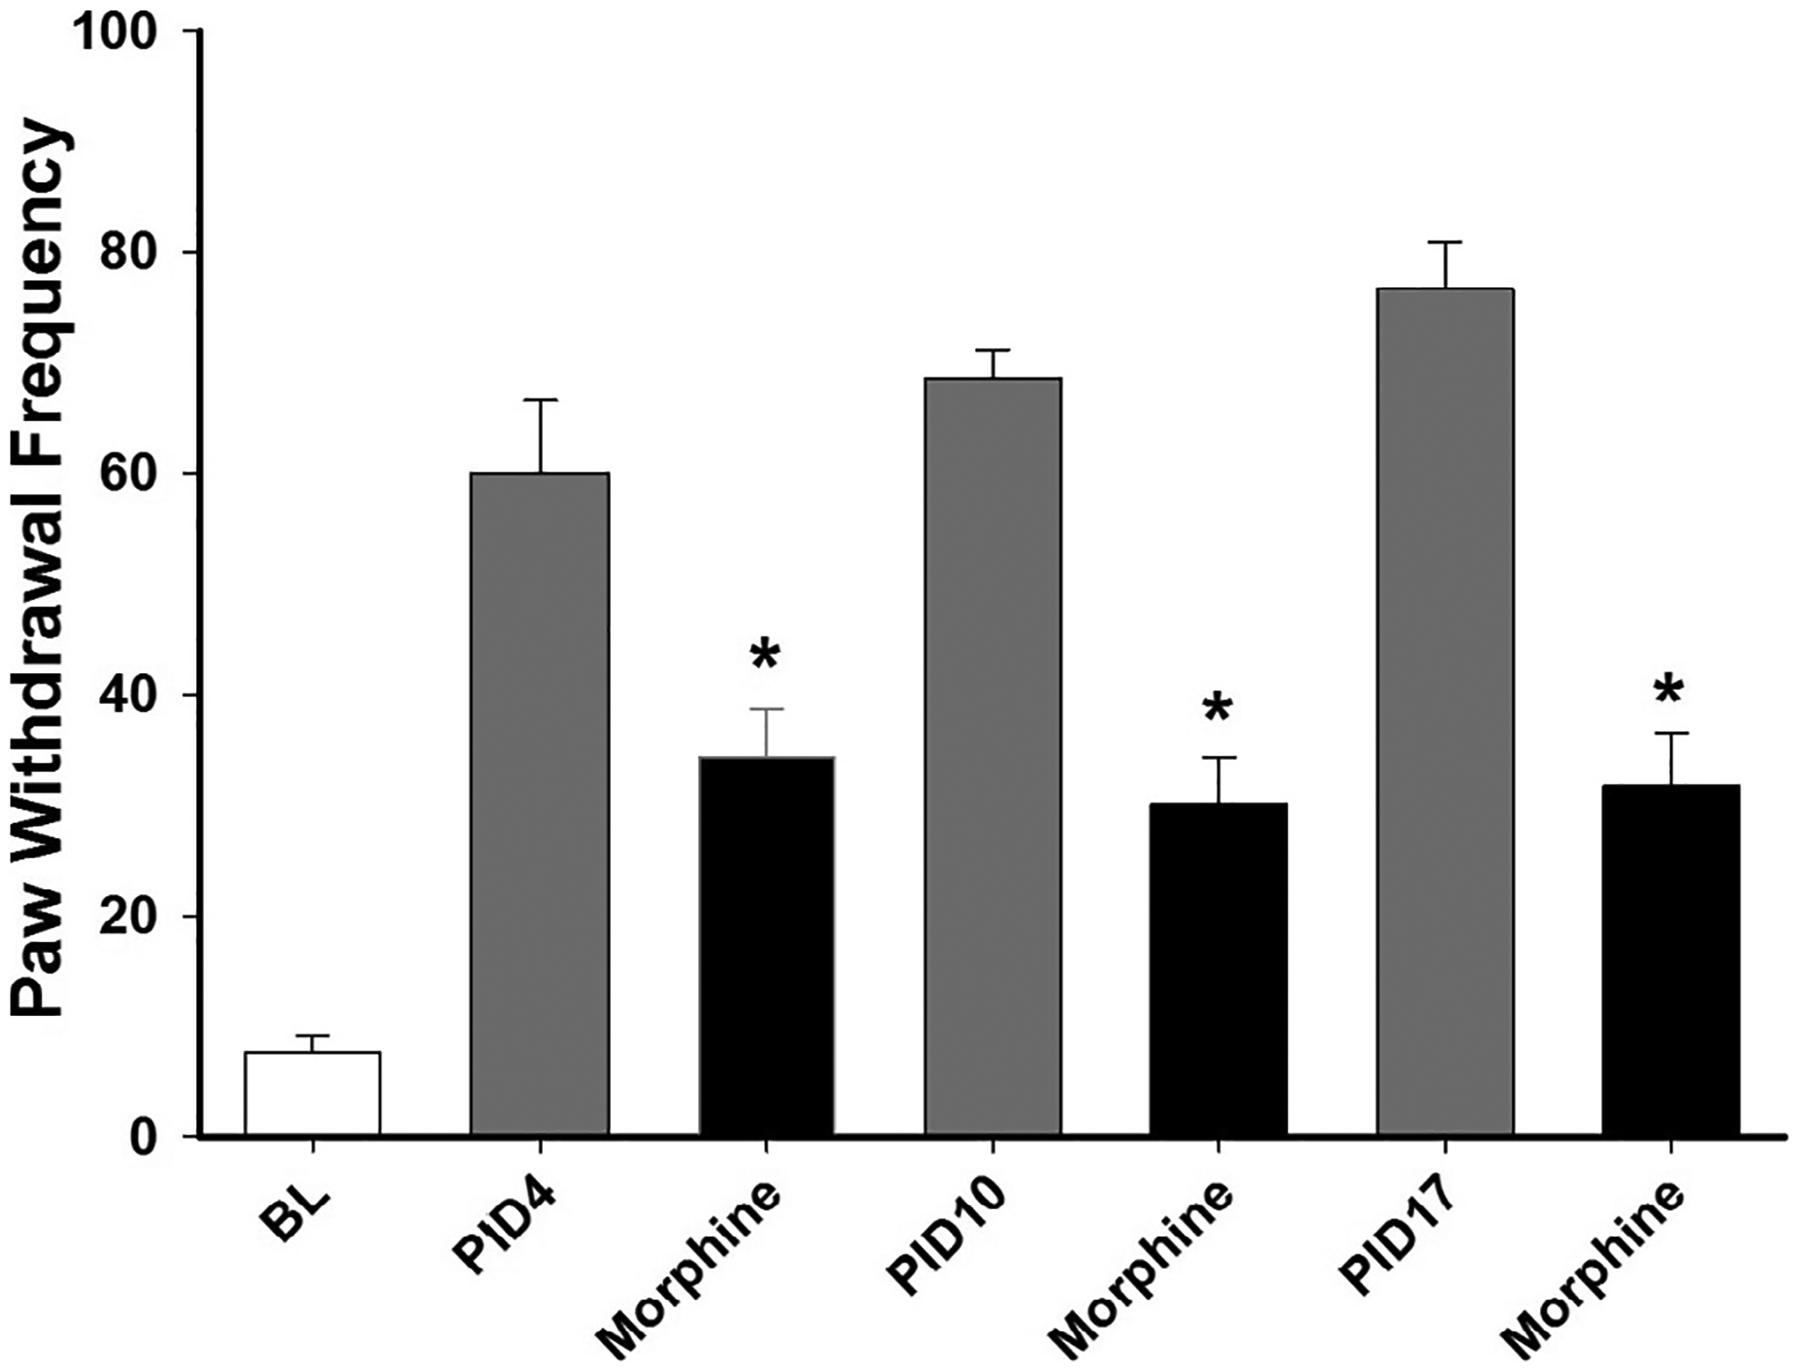
Fig. 3.

Antihyperalgesia produced by 2.5 mg/kg morphine (s.c.) at different PIDs. PWF was determined before (BL) cancer cell implantation and at 60 min after morphine. The white bar shows the mean paw withdrawal frequency before implantation of cancer cells. The grey and black bars show bars show mean paw withdrawal frequencies before and after morphine, respectively, on PIDs 4, 10 and 17. * indicates a significant difference from pre-drug values (Student-Newman Keuls test, p = 0.001.
