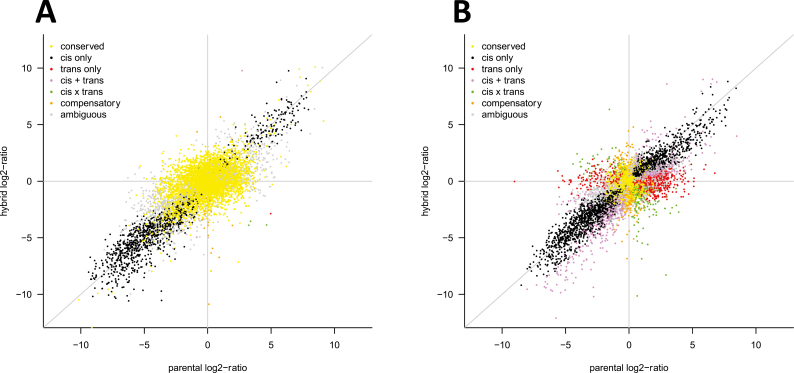
Fig. 4.
A global view of regulatory category assignment for one hybrid and its parents, in this case Morex and FT11. The x-axis shows the log2 ratio of expression difference between the parents, while the y-axis shows the log2 ratio of expression difference between the parental alleles in the hybrid. (A) The global view using the linear model method; (B) the method used by McManus et al. (2010).

