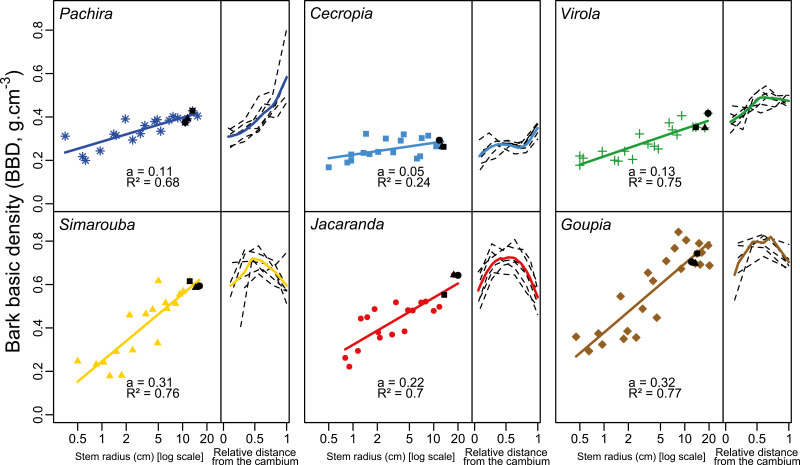
Fig. 4.
Ontogenetic and radial variation in bark basic density (BBD) in six tropical tree species in the tropical rainforest of French Guiana. For each species, BBD is plotted against the log-scaled stem radius; the slope value (a) and the goodness of fit (R2) are presented (left panels). For each species, the regression slope is statistically different from 0 (P<0.05). BBD is also plotted as a function of the relative distance from the cambium in three trees (two series of measurements per tree) (right panels), indicated on the overall regression by the black symbols (left panels). (This figure is available in color at JXB online.)

