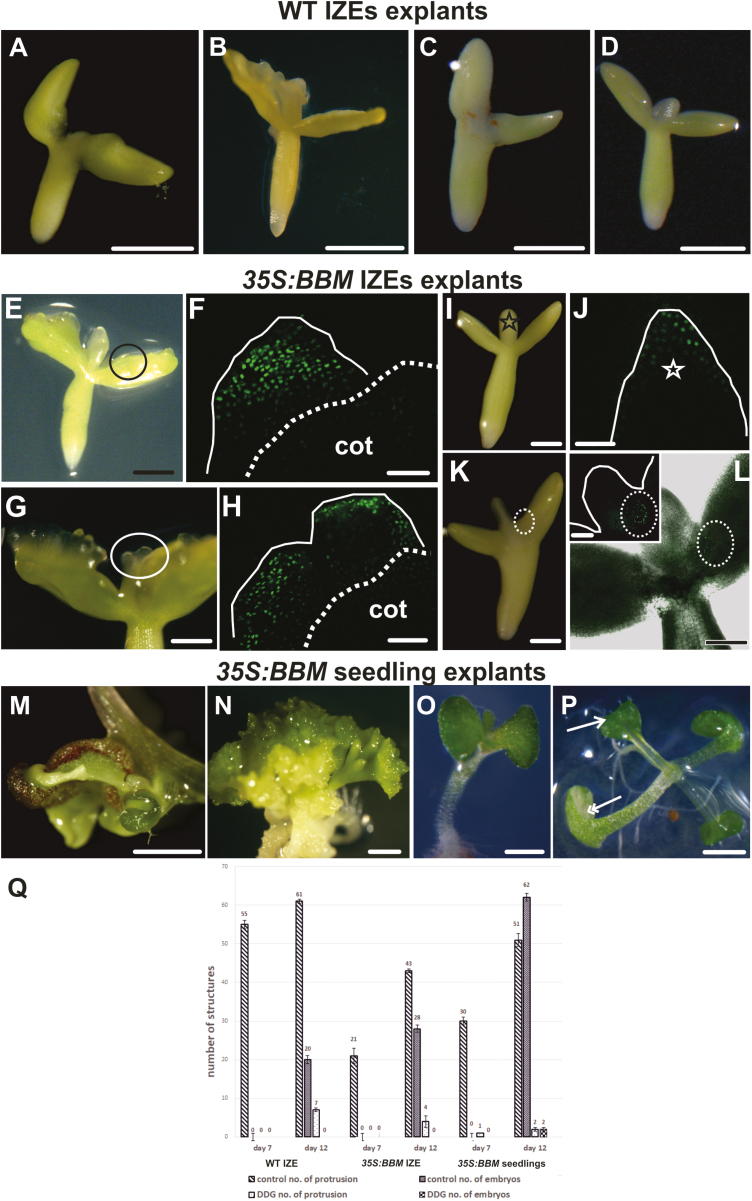
Fig. 8.
Inhibition of callose biosynthesis suppresses somatic embryo induction. (A–D) Control (A, B) and DDG-treated (C, D) WT IZE explants after 7 d (A, C) and 12 d (B, D) of culture. (E–H) Control 35S:BBM IZE explants after 7 d (E) and 12 d (G) of culture. (F) WOX2:NLS-YFP expression in the same area is shown in (E). The black circle in (E) marks a part of the explant with embryogenic protrusions. (H) WOX2:NLS-YFP expression in the same area as shown in (G). The white ellipse in (G) marks the somatic embryos. Dotted lines in (F) and (H) demarcate the areas engaged (above) and not engaged (below) in SE and the white line outlines the explant surface. (I–L) DDG-treated 35S:BBM explants after 7 d (I) and 12 d (K) of culture. Embryogenic protrusions were greatly reduced and somatic embryo formation was not observed after DDG treatment (I, K). (J, L) WOX2:NLS-YFP expression was either limited to a few cells of the explant in the shoot apical meristem, marked by the black star in (I) and white star in (J) and the cotyledon node (marked by the white dotted ellipse in K, L) or absent in all other parts of explants. (M, N) Control 35S:BBM seedling explants after 7 d (M) and 12 d (N) of culture showing well developed protrusions and somatic embryos. (O, P) Somatic embryogenesis is greatly suppressed in 35S:BBM seedling explants treated with DDG for 7 d (O) followed by an additional 5 d of culture on DDG-free medium (P) (single arrow marks the leaf, double arrows marks the cotyledons). (Q) SE cultures were treated for 12 d with 0.1 µM DDG and then scored on the indicated days for embryogenic growth (protrusions or somatic embryos). SE, standard error. The differences between means of control and DDG-treated replicates were compared using Dunnett’s test at P value<0.05. Scale bars: (A–D, M, N) 500 µm; (E, I, K, L) 200 µm; (F, H, J, L inset) 50 µm; (G) 100 µm; (O–P) 2 mm.

