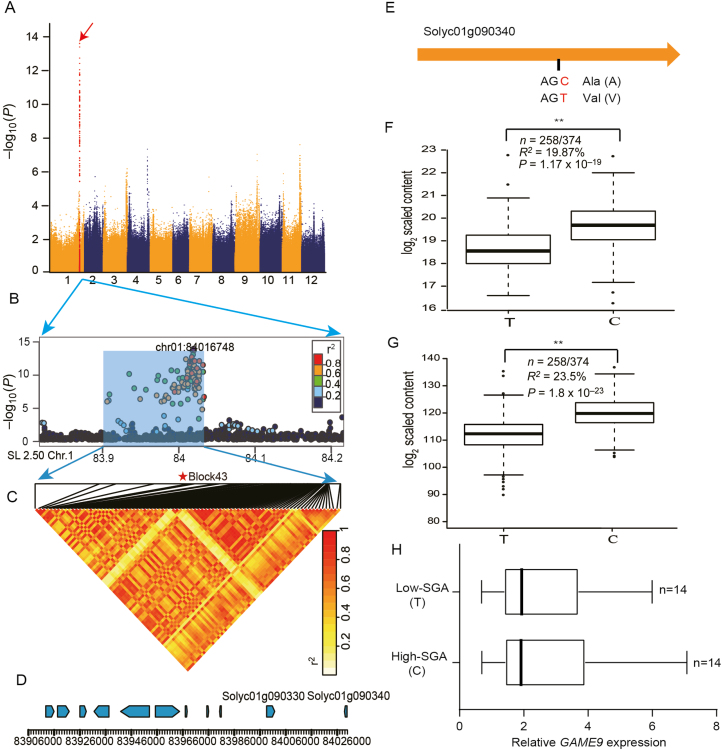
Fig. 1.
Loci associated with hydrotomatidine content. (A) Manhattan plot for a GWAS of SGA (hydrotomatidine) content. (B) Detailed plot for 83.9–84.2 Mb on chromosome 1 (x-axis). Lead SNP is indicated by darker shading. A representation of pairwise r2 values (a measure of LD) among all SNPs in region 83.9–84.2 Mb, where the shading of each box corresponds to the r2 value as shown by the key. (C) A representation of the pairwise r2 values among all polymorphic sites in the 122.7 kb genomic region corresponding to (B), where the shade of each box corresponds to the r2 value according to the key. Haploblock 43 (marked by star) contains lead SNP associated with fruit SGA content. (D) Gene structure of 11 genes in region 83.9–84.2 Mb, an unknown protein (Solyc01g090330), and an APETALA2/Ethylene Response Factor (Solyc01g090340) in haploblock 43. (E) Model and mutation for GAME9. (F) The effect of different alleles on the content of hydrotomatidine (SlFM1985). The data were plotted as a function of a particular SNP (ch01:84029382). The middle line of the box indicates the median, the box indicates the range of the 25th to 75th percentiles of the total date, the whiskers indicate the interquartile range, and the outer dots are outliers. (G) Total SGA content in different genotypes. The box plot (detailed information same as for (F)) includes measurements for hydrotomatidine (SlFM1985), hydroxytomatidenol (SlFM0960), hydroxytomatidine (SlFM0964), dehydrofilotomatine (SlFM1979), neorickiioside A (SlFM1983), lycoperoside H (SlFM1984), and lycoperoside A (SlFM1989). The data were plotted as a function of a particular SNP (ch01:84029382). (H) The relative expression of GAME9 in red ripe tomato fruit. n refers to the number of appropriate genotypes of tomato accessions used in this study. (This figure is available in color at JXB online.)

