Fig. 6.
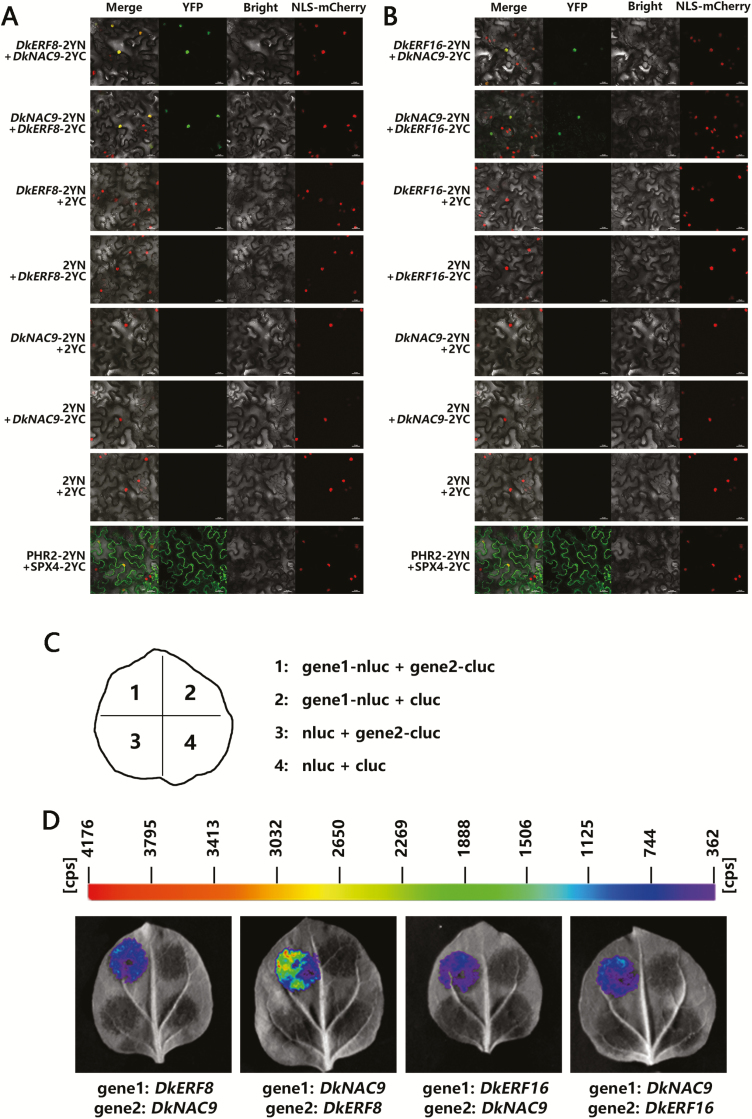
Protein–protein interactions between DkNAC9 and DkERF8/16 as analysed by bimolecular fluorescence complementation (BiFC) and luciferase complementation imaging (LCI) assays. Interactions between DkNAC9 and (A) DkERF8 and (B) DkERF16 as determined by BIFC. N- and C-terminal fragments of yellow fluorescent protein (YFP) (2YN and 2YC, respectively) were fused to the C-terminus of DkNAC9 and DkERF8/16, respectively. Combinations of 2YN or 2YC with the corresponding DkNAC9 and DkERF8/16 constructs were used as negative controls. PHR2-2YN + SPX4-2YC was used as the positive control. Fluorescence of YFP represents protein–protein interaction. Scale bars are 25 μm. (C) Schematic diagram of the injections for LCI, showing one experimental group and its three controls in a tobacco leaf. (D) Interactions between DkNAC9 and DkERF8/16 as determined by LCI. Combinations of nluc or cluc with the corresponding DkNAC9 and DkERF8/16 constructs were used as negative controls.

