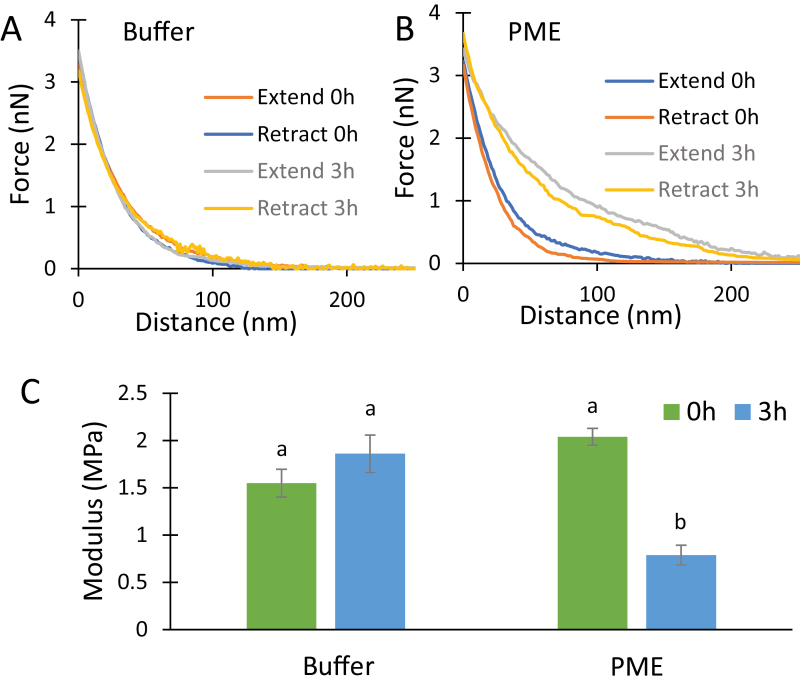
Fig. 2.
PME effect on AFM nanoindentation. Force–indentation measurements performed on onion epidermal walls submerged in 20 mM pH 7.5 HEPES buffer alone (A) and in buffer containing 50 µg ml–1 PME (B) at time 0 h and 3 h. The representative extend and retract curves have modulus values close to the average value of each treatment. (C) Modulus calculated by the Sneddon model using retract curves. Values are mean ±SE (23≤n≤24). Letters indicate statistical significance based on one-way ANOVA with post-hoc Tukey test (P<0.01).

