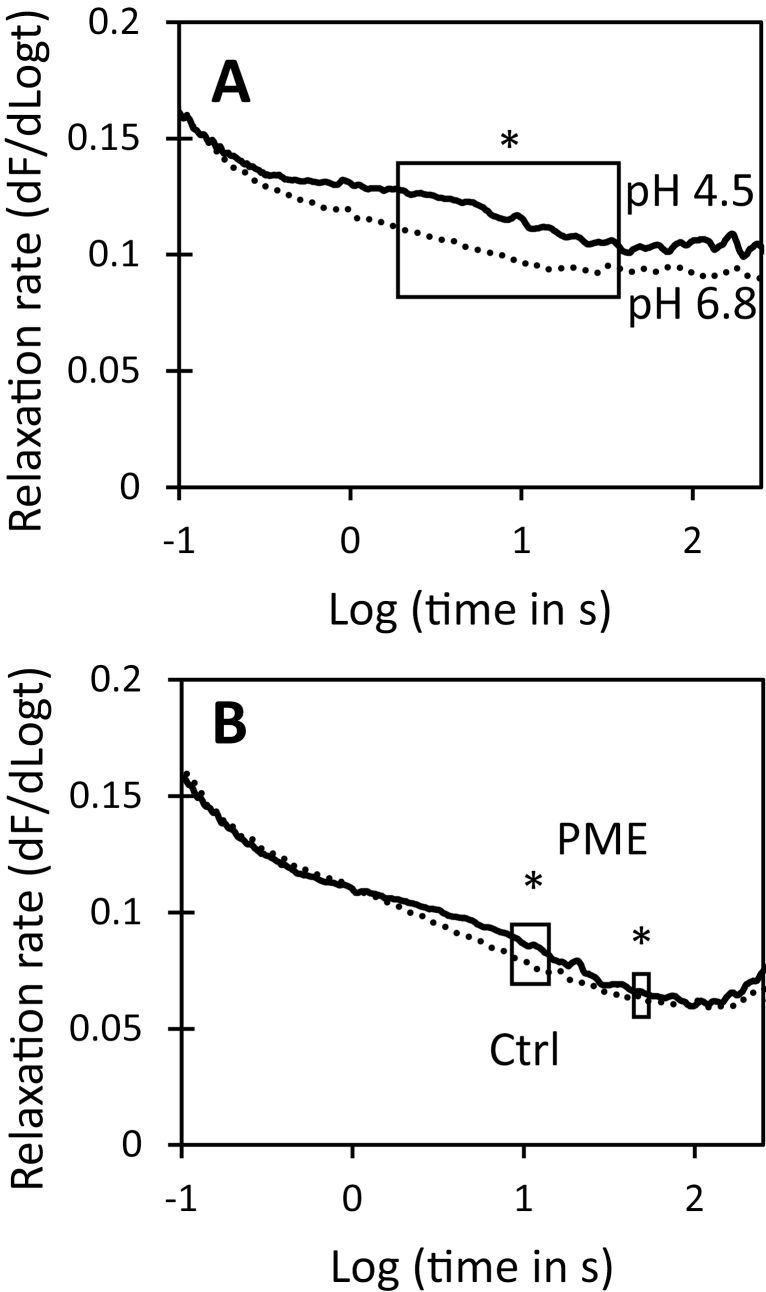
Fig. 8.
Effect of acid pH and PME pre-treatment on stress relaxation spectra of onion epidermal walls. Each curve is the average of 7–8 data sets. Boxed regions show statistically significant difference in relaxation rate. Student’s t-test was used to evaluate statistical significance (*boxed region different at P<0.05). (A) Walls in acidic (pH 4.5) buffer have greater stress relaxation than walls in neutral (pH 6.8) buffer. (B) Stress relaxation spectra of walls after 3 h incubation in 20 mM HEPES pH 7.5 ±PME.

