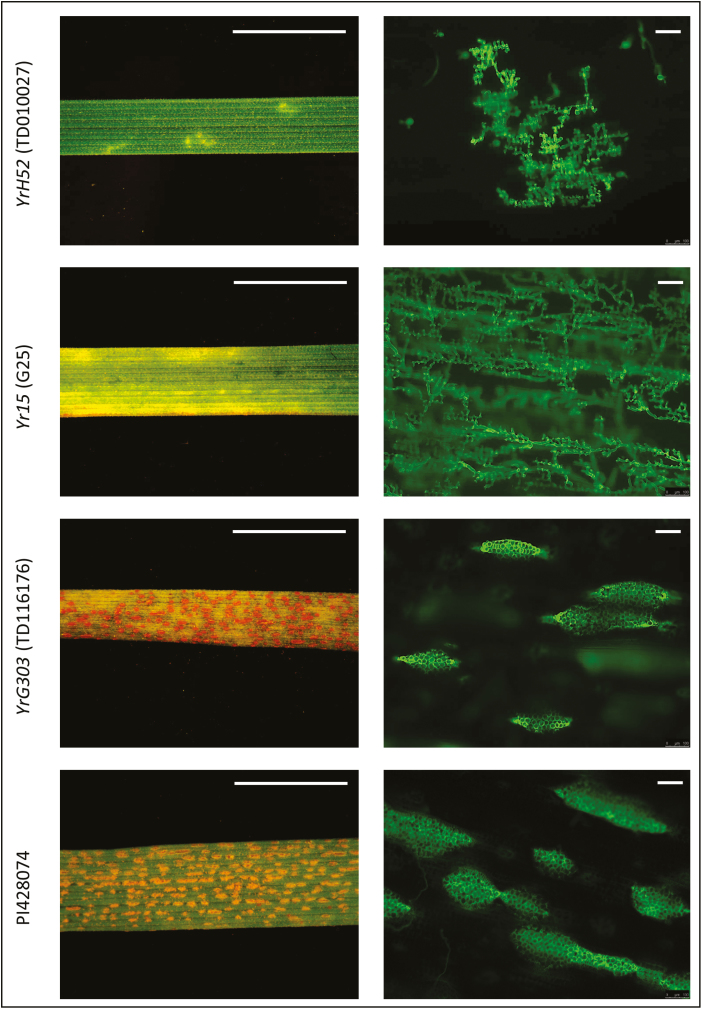
Fig. 1.
Differences in seedling phenotypic responses of WEW accessions donors of YrH52, Yr15, and YrG303, and the susceptible control PI428074 accession, at 14 dpi with Pst isolate #5006. Left panel: binocular microscopic observation of hypersensitive response and fungal sporulation (scale bar=1 cm). Right panel: sizes of fungal colonies and uredinia bags visualized by the fluorescent dye WGA–FITC (scale bar=100 µm). Note that G303 plants exhibited variable levels of resistance responses upon inoculation at the seedling stage (IT1–IT5) and only predominant IT5 is presented here. (This figure is available in color at JXB online.)

