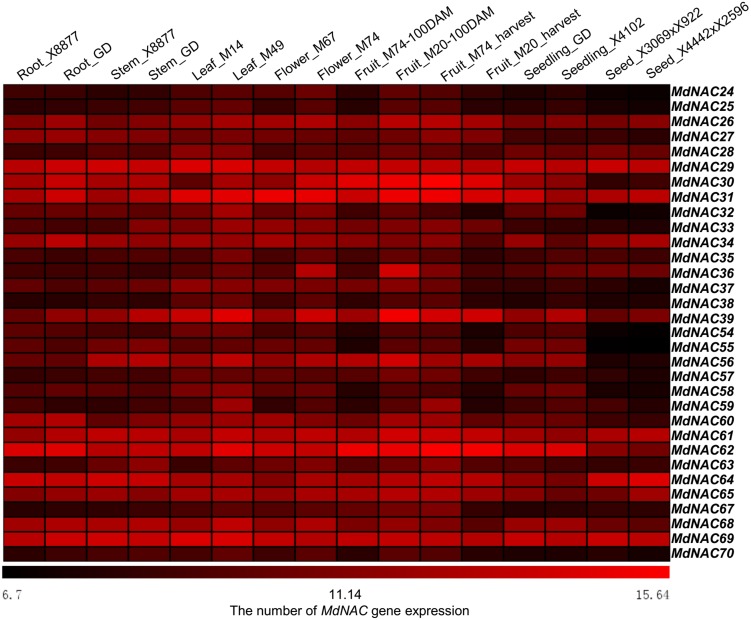
Figure 3. Expression profiles of apple MdNAC genes in various tissues.
The data of apple MdNAC expression (GSE42873) in 16 different were searched at GEO database in NCBI. The heat map of apple MdNAC genes was generated by TIGR MeV v4.8.1 software. Each horizontal row represents a number of gene expression with its MdNAC, and the vertical columns represent different tissues from left to right.

