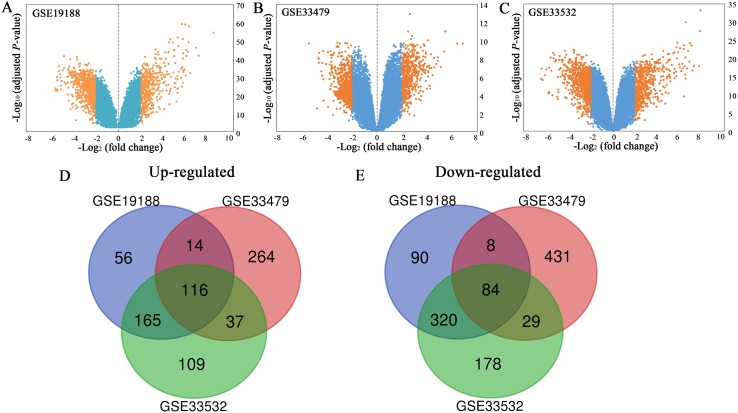
Figure 1. Volcano plots (A–C) and Venn diagrams (D and E).
(A–C) The DEGs of GSE19188, GSE33479 and GSE33532. The orange dots represent DEGs filtered based on the cutoff criteria of adjusted P-value < 0.05 and |log2 (fold change)| ≥ 2. While the blue dots represent genes that are not satisfied the cutoff criteria. The genes with log2 (fold change) ≥ 2 were up-regulated and the genes with log2 (fold change) ≤ −2 were down-regulated. (D and E) The common up-regulated and down-regulated DEGs in the three datasets.

