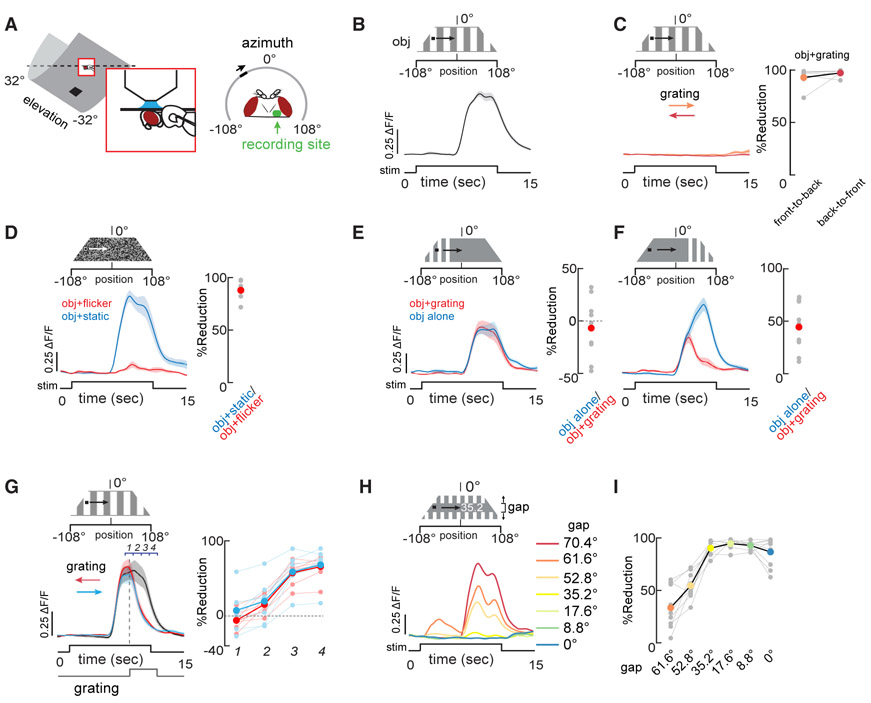
Figure 1. Background Motion or Flicker Suppress Object Responses in LC11.
(A) Recording setup: two-photon imaging of GCaMP and LED display for visual stimuli.
(B and C) An 8.8 × 8.8° dark object was moved at 22°/s across the display in the direction shown. A low contrast grating was displayed behind the dark object and was either stationary (B, black trace) or moved horizontally in either direction at 22°/s (C, red, orange traces). n = 8 flies. Reduction in maximum amplitude compared to the stationary background is shown for individual animals (right, gray dots; colored dots indicate the mean across animals).
(D) Each 2.2° pixel on the LED display was flickered at 10 Hz at random (red trace) or was static (blue trace) behind the dark object as it moved across the display. n = 6, shading shows SEM. Reduction in maximum response amplitude when the background was flickered. Red dot shows the mean.
(E and F) Same as (C) except that the grating was displayed only on ¼ of the display screen and either on the contralateral side (E) or ipsilateral side (F). The grating was either stationary (blue trace) or moving (red trace). n = 9. Reduction in maximum response amplitude when the square-wave grating was moving.
(G) Same as (C) except that grating motion onset was delayed until the vertical dashed line. Grating direction indicated by arrows. Reduction in maximum amplitude in the shown epochs 1–4. n = 8.
(H) The grating is displayed on the upper and lower edges of the display and parameterized for the size of the open gap in the object path. The largest gap corresponds to the largest LC11 response. SEM shading is omitted for clarity. n = 9.
(I) Reduction in maximum response amplitude across varying open gaps along the object path. Colored dots correspond to the indicated gaps in (G).
Shading around mean traces indicate SEM. Gray dots indicate individual animals. Red dots in right side panels indicate the mean reduction in maximum amplitude.

