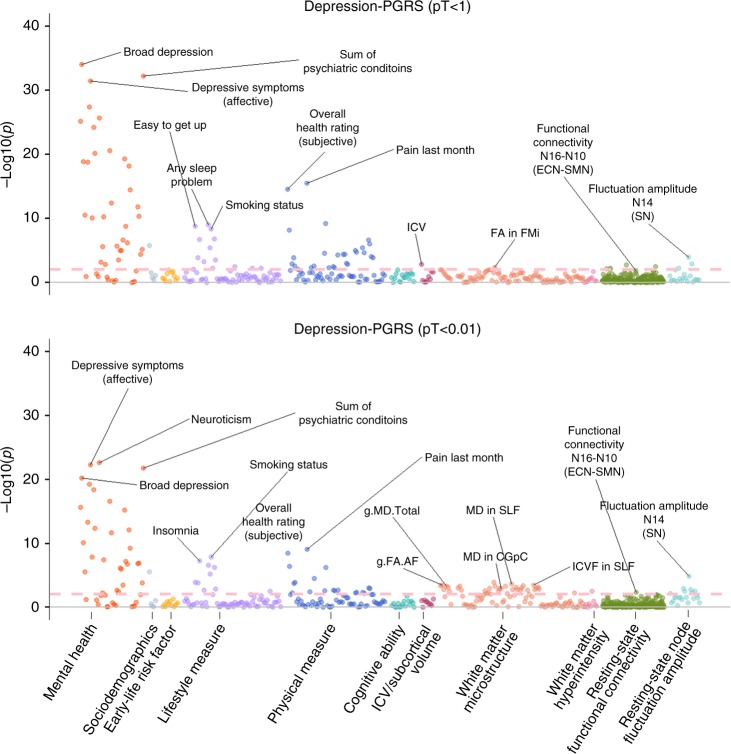
Fig. 1. Significance plot for all phenotypes for depression-PRS at p threshold (pT) < 1 and pT < 0.01.
The x axes represent phenotypes, and the y axes represent the −log10 of uncorrected p values of two-sided test for linear regression between depression-PRS and each of the phenotype. Each dot represents one phenotype, and the colours indicate their according categories. The dashed lines indicate the threshold to survive FDR correction. FDR correction was applied over all the traits and all depression-PRS (see “Methods”). From left to right on the x axis, categories were shown by the sequence of mental health measure, sociodemographics, early-life risk factor, lifestyle measure, physical measure, cognitive ability, intracranial/subcortical volume, white matter microstructure, white matter hyperintensity, resting-state functional connectivity and resting-state fluctuation amplitude. Representative top findings are annotated in the figure. SN salience network, ECN executive control network, SMN sensorimotor network, FA fractional anisotropy, MD (for white matter microstructure) mean diffusivity, ICVF intra-cellular volume fraction, AF association fibres, FMi forceps minor, SLF superior longitudinal fasciculus, CGpC cingulate gyrus part of cingulum.

