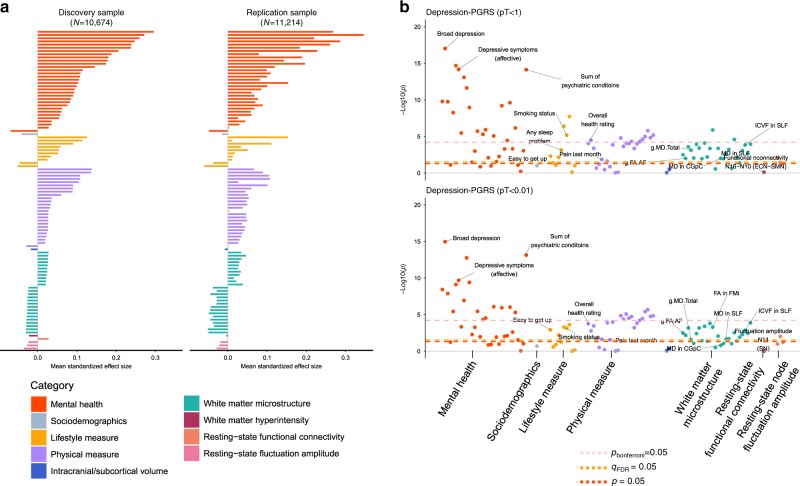
Fig. 3. Results for replication analysis.
a Comparisons of effect sizes for the discovery and replication samples. The x axes represent the mean standard effect size across depression-PRS at all eight p thresholds for generating depression-PRS (pT). Colours for the bars indicate their categories (from top to bottom: mental health measure, sociodemographics, lifestyle measure, physical measure, intracranial/subcortical volume, white matter microstructure, white matter hyperintensity, resting-state functional connectivity, and resting-state fluctuation amplitude). b Significance plot for the replication analysis on representative depression-PRS at pT < 1 and pT < 0.01, in accordance with Fig. 1. The x axes represent phenotypes, and the y axes represent the −log10 of uncorrected p values of two-sided test for linear regression between depression-PRS and each of the phenotype. Each dot represents one phenotype, and the colours indicate their according categories. The yellow dashed lines indicate the threshold to survive FDR-correction. FDR-correction was applied over all the traits and all depression-PRS (see “Methods”). The pink and red dashed lines indicate the threshold to survive Bonferroni correction and nominally significant threshold. Top hits shown in the discovery sample (Fig. 1) are annotated in the figure. Explanations for the abbreviations can be found in the legend of Fig. 1.

