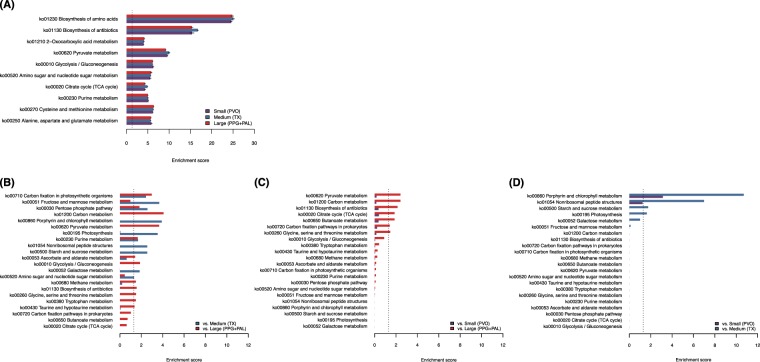
Figure 5.
Enrichment analysis for predictive KEGG metabolic pathways of “within” and “between” flying squirrels’ gut microbiota. (A) Top 10 of “within” FS comparisons of KEGG metabolic pathways. All 43 significantly enriched pathways are shown in Fig. S5. (B–D) The “between” FS comparisons of KEGG metabolic pathways; (B) The enriched metabolic pathways of small FS by comparisons to medium and large FS, respectively; (C) medium FS by comparison to small and large FS; (D) large FS by comparison to small and medium FS. The dash lines indicate that the FDR q-value = 0.05. PVO, Pteromys volans orii; TX, Trogopterus xanthipes; PAL, Petaurista alborufus lena; PPG, Petaurista philippensis grandis.

