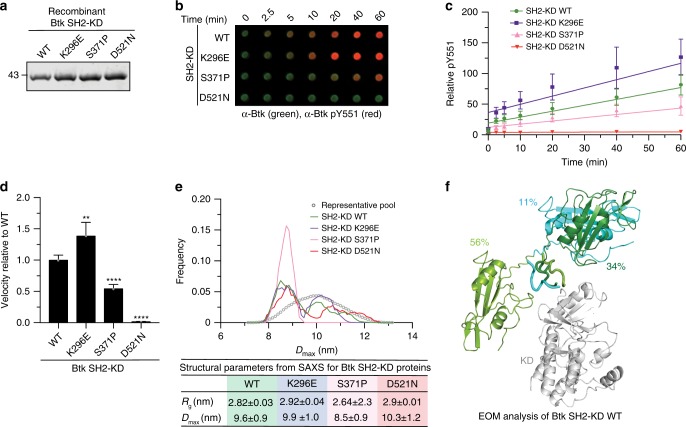
Fig. 4. Mutation on the Btk SH2-KD interface perturbs its active conformation and decrease kinase activation.
a Representative SDS-PAGE analysis of recombinant untagged SH2-KD proteins purified from Sf9 cells. b In vitro autophosphorylation assay performed with recombinant Btk proteins at room temperature. The levels of pY551 (red channel) and total Btk (green channel) were assessed using immunoblotting in a dot blot apparatus. c Btk autophosphorylation kinetics shown in b normalized to total Btk signal and the calculated slopes of linear fits (relative velocities). Data shown are the mean ± SD of two independent experiments (n = 6). d Relative velocities of Btk autophosphorylation relative to wild-type. Data are mean ± SD of two independent experiments (n = 6) and P-values were calculated using an unpaired t-test. **P ≤ 0.01 and ****P ≤ 0.0001. e Flexibility analysis of SH2-KD based on ensemble of optimization method (EOM) using the experimental SAXS data from recombinant Btk wild-type and mutant proteins. Data from a representative experiment shows the maximal particle dimension (Dmax) of selected conformers for each protein (lines) from a representative pool of theoretical conformations (dotted line). The table summarizes the obtained structural parameters (Rg and Dmax ± error). See Supplementary Table 2 for details. f Cartoon representation of the ensemble of SH2-KD conformations selected by EOM analysis (e, green line). The percentages represent the contribution of each conformer to a SAXS profile in good agreement with the experimental curve. The KD is represented in white and SH2 conformers are colored. SH2-linker distance estimated by the algorithm is represented as ribbon. Source data are provided as a Source Data file.

