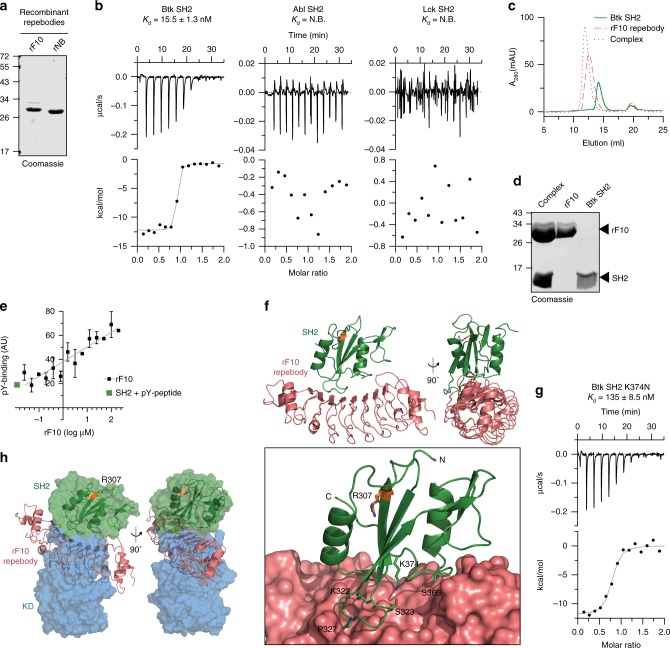
Fig. 5. Development of a high-affinity protein binder to the human Btk SH2 domain.
a Representative SDS-PAGE analysis of recombinant repebodies rF10 and rNB purified from E. coli. b Representative ITC measurement of rF10 repebody to the SH2 domains of Btk, Abl and Lck kinases. The top panel show the raw signal and the bottom panel show the integrated calorimetric data of the area of each peak. The continuous line shows the best fit to the experimental data assuming a 1:1 binding model. Reported Kd value for Btk was calculated from three independent measurements. N.B. signifies non-binding. c Size-exclusion chromatogram (SEC) analysis of Btk SH2 and rF10 alone, and the SH2-rF10 complex formed by pre-incubation of SH2 and rF10 prior to column injection. d Peaks isolated from the SEC analysis shown in c resolved by SDS-PAGE and stained with Coomassie. e Binding-competition assay using fluorescently labeled pY-peptide to recombinant Btk SH2 domain in the presence of various concentrations of rF10 repebody. Data are mean ± SD from three technical replicates. f Cartoon representation of the crystal structure of human Btk SH2 (green) in complex with rF10 repebody (salmon), PDB 6HTF. Structural statistics are reported in Supplementary Table 3. The bottom panel shows the rF10 in surface representation, residue R307 (orange) indicates the position of the pY-binding site, and side chains of SH2 residues interacting with rF10 are shown as green sticks. g ITC measurement of rF10 repebody to Btk SH2 K374N performed as in b. The Kd value was calculated from two independent measurements. h Superimposition of the active Btk SH2-KD model (surface representation, SH2 in green and KD in blue) with the rF10-SH2 structure (cartoon representation, SH2 in green and rF10 in salmon). Source data are provided as a Source Data file.

