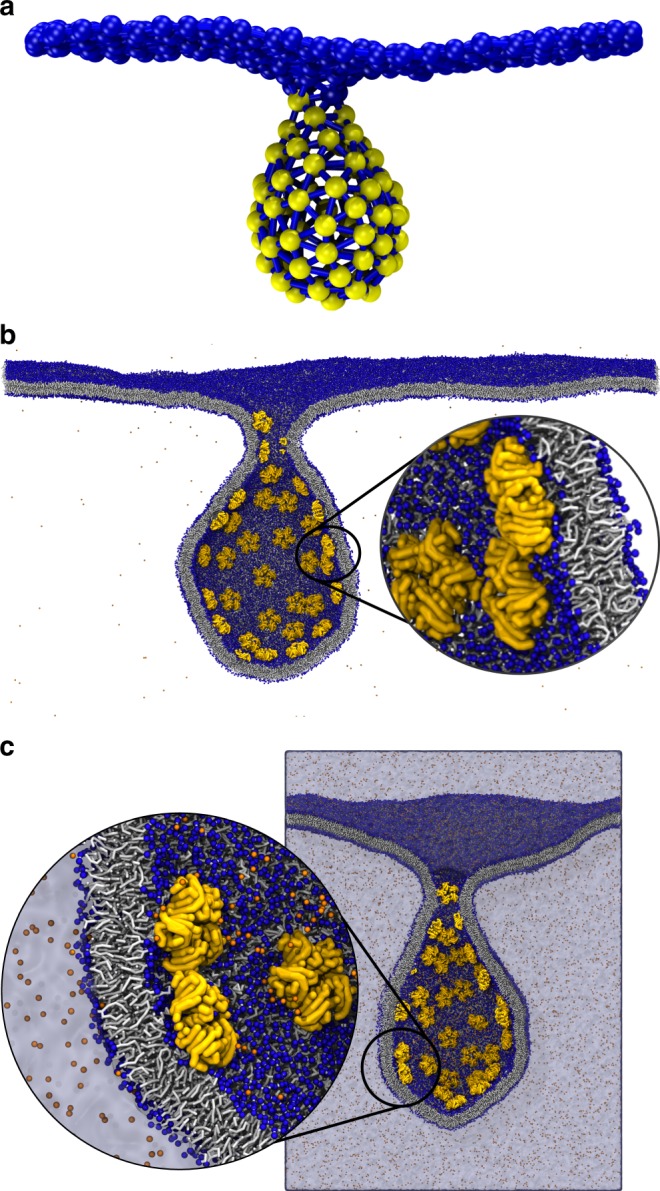
Fig. 4. Backmapping of an endocytic bud formed by STxB proteins.

a Configuration obtained from DTS simulation. Yellow beads are vertices occupied by STxB inclusion, Blue beads are vertices representing the membrane surface. b Configuration from the solvent-free CG Martini model, after a 200 ns simulation starting from the backmapped DTS structure. Yellow objects are STxB proteins, orange dots are ions, blue beads are phosphate groups of the DOPC lipids and lipid chains are shown in gray. c Final CG configuration obtained with standard Martini model after a 50 ns simulation. The color code is the same as b.
