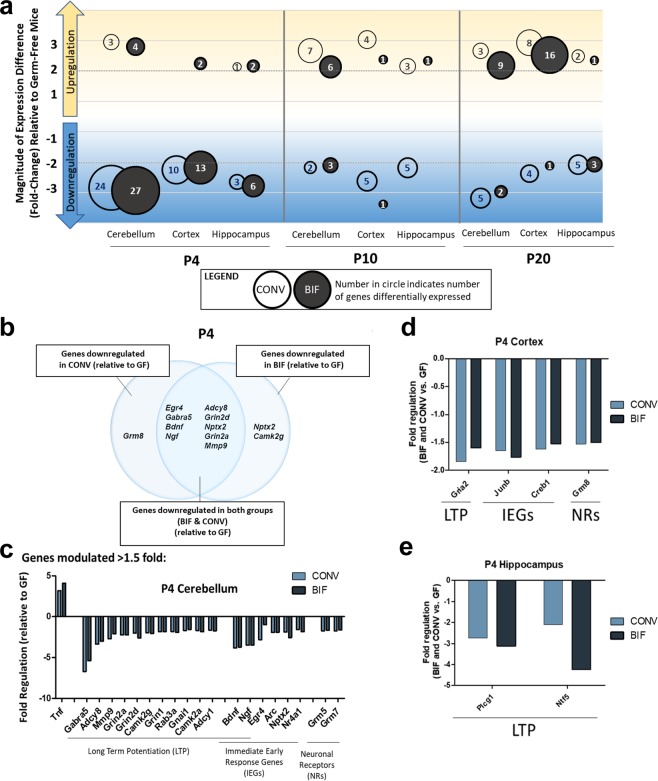
Figure 2.
Summary analysis indicating significant downregulation of gene expression in colonized mice during early postnatal development. (a) Plot summarizes the results of the qPCR array. Values inside the circles represent the number of genes differentially expressed relative to germ-free control mice at each postnatal timepoint, in each brain region. The magnitude of the fold-change is indicated by position on the graph. CONV (open circle) and BIF (closed circle). (b) Comparison of downregulated genes in P4 mice (BIF relative to GF, CONV relative to GF, and genes downregulated in both BIF and CONV mice relative to GF). (c-e) Genes differentially expressed in BIF and CONV mice >1.5 fold in the P4 mice Cerebellum (c), Cortex (d), and Hippocampus (Figure 1.) (*No error bars or statistical significance bars are shown due to the pooled samples used for this analysis, PCR array of RNA from n = 5 male mice/group/timepoint/brain region).

