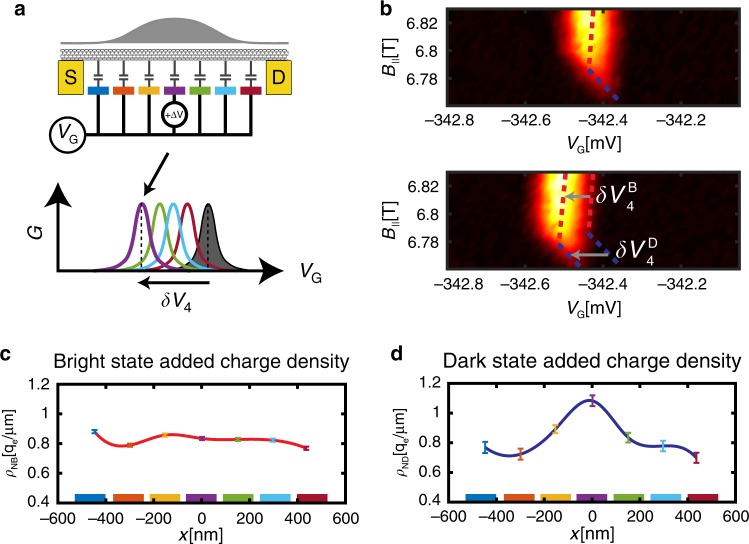
Fig. 3. Imaging the bright and dark states’ spatial charge distributions.
a The charge distribution of a state is imaged by measuring its independent capacitances to each of the individual gates (colored). This is achived by monitoring how the state’s Coulomb blockade charging peak (gray, bottom) shifts in common gate voltage, VG, when a small voltage perturbation, ΔV, is added to each of the gates (colored peaks). The individual shifts are directly proportional to the local charge densities above the corresponding gates. b Top: Zoom-in on the triple point in the white box in Fig. 2c. Bottom: Same triple point when a perturbation ΔV = 0.5 mV was added to gate 4. Bright and dark states charging lines (dashed red and blue) have independent shifts along VG, labeled and . c Measured spatial distribution of the bright state added charge, ρNB(x), where x is the spatial coordinate along the nanotube. Colored points (with 1σ confidence errorbars) correspond to the voltage shifts measured with the corresponding gates (colored gates are plotted along the x axis at their actual spatial cordinates). The red spline connecting the measured points is a guide to the eye. Notably, the bright state charge is spread rather homogenously along the suspended nanotube. d Similarly measured spatial distribution of the dark state added charge, ρND(x), observed to be concentrated at the center of the confinement well.

