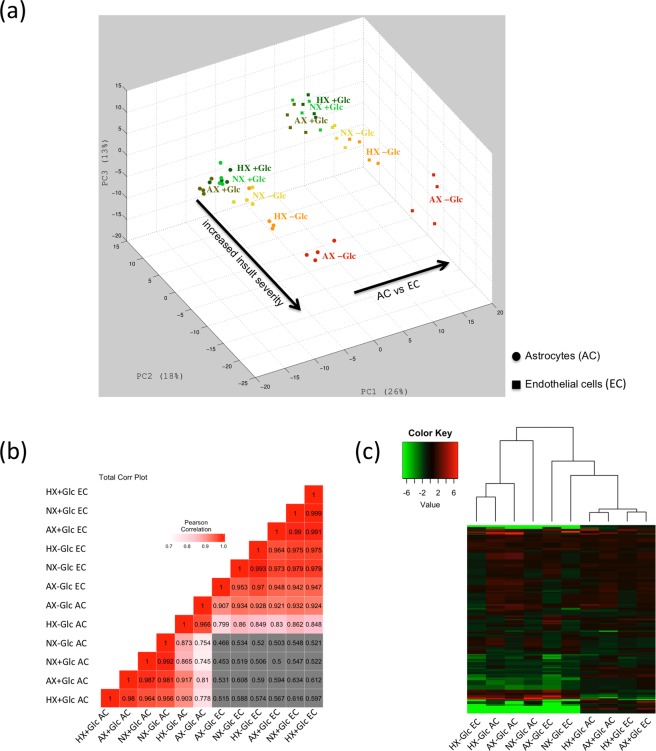
Figure 1.
Metabolome compositions differ strongly for both cell type and insult severity. (a) Principal component analysis of the metabolomes of AC (circles) and EC (squares) exposed to normoxia, hypoxia and near anoxia in presence and absence of glucose. Axes represent the first three principal components (PC) of the dataset and their contribution to overall metabolome variance in percent (%). (b) Correlation matrix plot of all AC and EC conditions. The Pearson correlation coefficients were calculated by log2 transformed ratios of the median values of fold changes and are represented by gradient colors as indicated in the color key. Correlations less than 0.6 are shown in gray. (c) Hierarchical clustering heatmap of different injury conditions in AC and EC samples. Metabolites significantly decreased are displayed in green and those significantly increased displayed in red. The brightness of each color corresponds to the magnitude of the difference when compared with average values. Normoxia (NX), hypoxia (HX) and near anoxia (AX) in presence and absence of glucose (±Glc). To enable comparison of data between the cell types, the metabolite intensities were normalized to total ion counts. n = 4.

