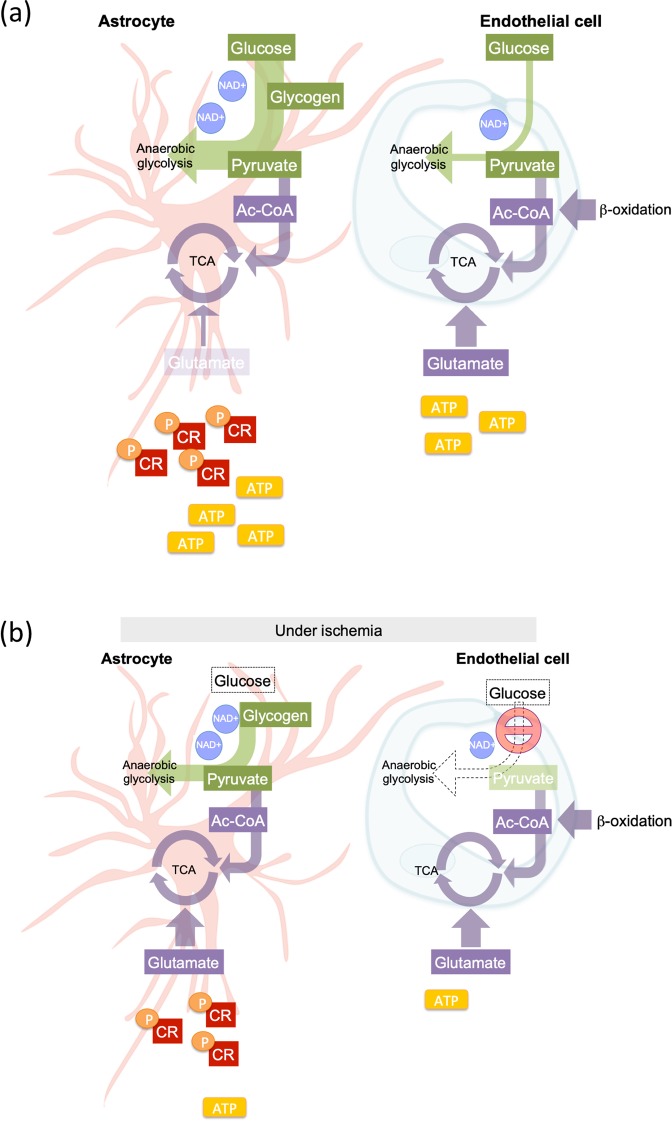
Figure 7.
Schematic overview of energy generation by AC and EC. We propose the following cellular models of energy generation; (a) Under normoxic/resting conditions, AC predominantly use glucose to support glycogenesis and anaerobic glycolysis (green) as well as the TCA cycle (purple) via pyruvate synthesis. Brain EC sparingly utilize glucose directly to support glycolysis, but glutamate and/or β-oxidation likely contribute to EC TCA cycle to maintain the central carbohydrate metabolism. (b) During injury conditions, elevated glycogen and pyruvate reserves, pCR as well as excellent antioxidant capacity in AC demonstrate a high metabolic flexibility. Comparatively EC are more metabolically rigid, attempting to sustain their resting/baseline profile at almost all cost. Arrow thickness represents the degree of pathway activity. The number of repeated circles (NAD + ) and rectangles (ATP and CR) indicate the metabolite level. Metabolite abundance is indicated by rectangle transparency with dark and light depicting high and low levels respectively under different conditions. The dotted arrow indicates inactivated pathways.

