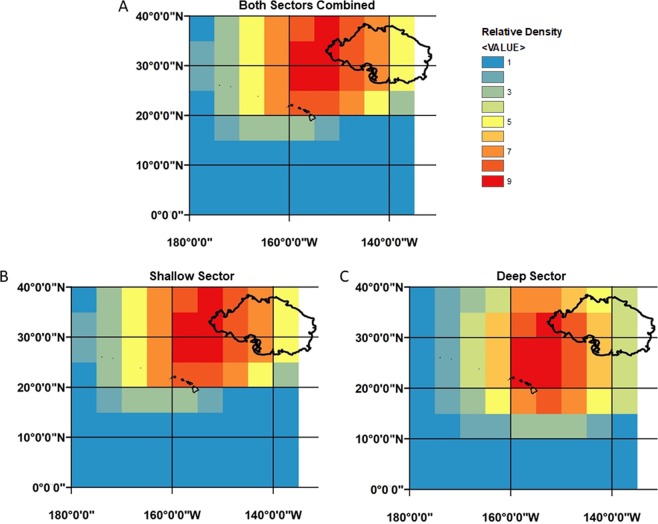
Figure 1.
Relative density of marine debris, namely derelict fishing gear, found within 5 × 5 degree raster cells as reported by PIROP fishery observers in the Hawai’i-based pelagic longline fishery during 2008–2016. Relative densities for combined sectors (A), shallow (B) and deep (C) sectors were estimated from original point data representing the haul begin latitude and haul begin longitude of individual longline sets where at least one item of marine debris was intercepted (N = 858). Interpretation of the density surface is qualitative; cooler colors have fewer sets relative to warmer colors. In addition, estimated relative density values are interpreted in relation to the lowest relative density (value = 1, color = blue). Thus, red cells have a longline set density that is nine times as large as the blue cells. The estimated boundary for the Great Pacific Garbage Patch (large black polygon, upper right) is based on plastic mass concentrations for August 2015, as predicted by the models of Lebreton et al.5. The main Hawaiian Islands (small black polygons, mid-grid) are centered near 19° 34′N and 155° 30′W (Hawai’i) to 21° 54′N and 160° 10′W (Ni’ihau).

