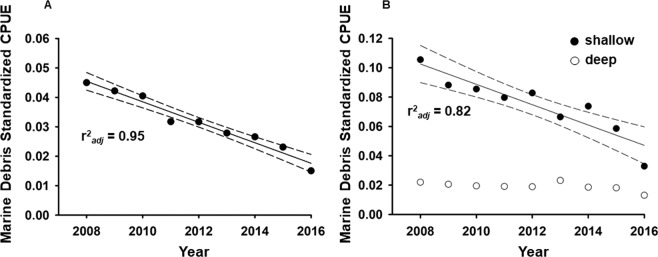
Figure 3.
(A) Annual standardized CPUE (marine debris items per standardized longline set) in the Hawai’i-based pelagic longline fishery during 2008–1016, all sectors. The solid line represents the time trend regression and the associated 95% confidence intervals are indicated by dashed lines. (B) Annual standardized CPUE (marine debris items per standardized longline set) in the Hawai’i-based pelagic longline fishery during 2008–2016, by sector. The shallow sector is indicated by closed circles while the deep sector is indicated by open circles. The solid line represents the time trend regression and with associated 95% confidence intervals (dashed lines).

