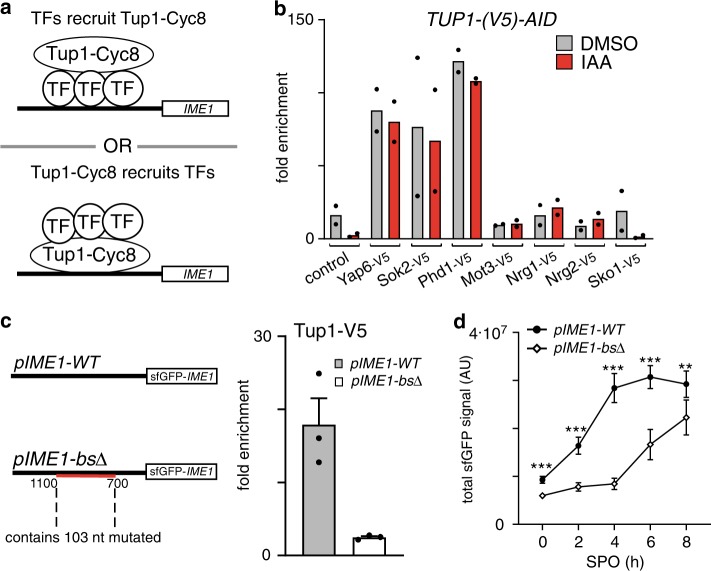
Fig. 3. Tup1–Cyc8 is recruited by TFs associated with the IME1 promoter.
a Schematic displaying how TFs and Tup1–Cyc8 could interact at the IME1 promoter. TF = transcription factor. b Diploid cells harbouring TUP1-AID and V5-tagged TFs (YAP6-V5, FW4214; SOK2-V5, FW4218; PHD1-V5, FW5056; MOT3-V5, FW4229; NRG1-V5, FW4230; NRG2-V5, FW5055; SKO1-V5, FW4224) were grown to exponential phase. As a control, TUP1-AID (FW5057) cells were also included, which also harbour a V5 tag. Cells were either treated with IAA or DMSO, and the binding of each transcription factor was determined by ChIP and normalised over HMR. Mean of n = 2 is shown. c Binding of Tup1 is affected in cells lacking transcription factor binding motifs in the IME1 promoter. Diploid cells with a chromosomal deletion of the IME1 locus, and an integrated plasmid that contained the full IME1 gene fused with sfGFP at the amino terminus and the wild-type promoter (pIME1-WT, FW5370) or the same construct with all the candidate motif sequences mutated (pIME1-bsΔ, FW5372) were used for the analysis. These cells also expressed TUP1-V5. The binding of Tup1 was determined by ChIP. Mean and SEM of n = 3 are shown. d Expression of Ime1 during entry into meiosis in pIME1-WT and pIME1-bsΔ cells. Strains described in c were grown till saturation in rich medium (YPD), grown for an additional 16–18 h in pre-sporulation medium (BYTA), and subsequently shifted to sporulation medium (SPO). The levels of Ime1 expression were determined by imaging and quantifying the fluorescent signals generated by sfGFP-Ime1 in single cells (n = 50 cells per sample). The mean of signals detected and error bars representing the 95% confidence interval are displayed. Unpaired parametric two-tailed Welch’s t test with 95% confidence was used and p values (** = ≤0.01, *** = ≤0.001) are indicated.

