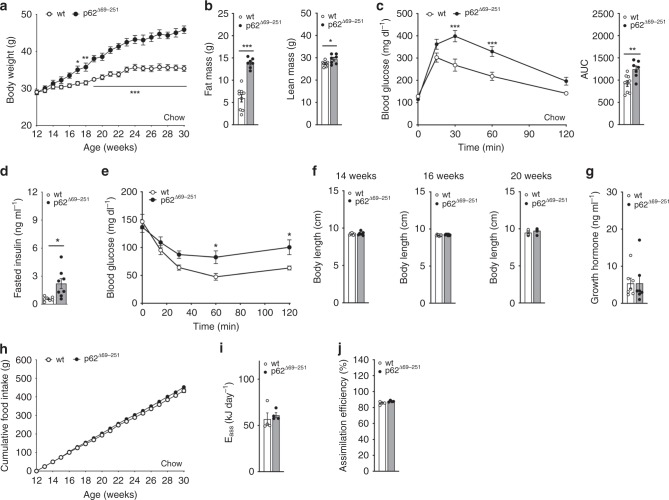
Fig. 1. Metabolic phenotype of chow-fed male p62Δ69-251 mice.
Body weight development (a) as well as body composition (b) and glucose tolerance (c) in 31-wk-old male C57Bl/6J wt or p62Δ69-251 mice. Fasted insulin levels (d) and insulin sensitivity (e) in 24-wk-old male mice. Body length at the age of 14, 16, or 20 wks (f). Growth hormone at the age of 14 wks (g). Cumulative food intake (h) as well as assimilated energy (i) and assimilation efficiency (j) at the age of 30 wks. Sample sizes are (a–c) n = 9/7 mice, (d, e) n = 7/8 mice, (f) n = 7/7 mice, n = 8/8 mice, n = 8/8 mice, (g) n = 7/7 mice. Cumulative food intake (h) was assessed per cage in n = 6/4 cages containing n = 9/7 mice. For panels (i) and (j), feces were collected per cage in n = 4/4 cages containing n = 8/8 mice. Data represent mean ± SEM. Longitudinal data in panels (a), (c), (e), and (h) were analyzed using two-way ANOVA with time and genotype as co-variant and using Bonferroni post hoc multiple comparison analysis for differences at individual time points. Bar graphs in panels (b), (c), (d), (f), (g), (i), and (j) were analyzed using two-sided two-tailed t-test. *p < 0.05; **p < 0.01; ***p < 0.001. Exact p-values are (a) d17 p = 0.0318, d18 p = 0.0125, d19 p < 0.0001, d20 p = 0.0002, d21–d30 p < 0.0001; (b) p = 0.000001996 and p = 0.0228; (c) 30 min p < 0.0001, 60 min p = 0.0004; AUC p = 0.00467; (d) p = 0.0132; (e) 60 min p = 0.0237, 120 min p = 0.0358. AUC area under curve, Eass assimilated energy.

