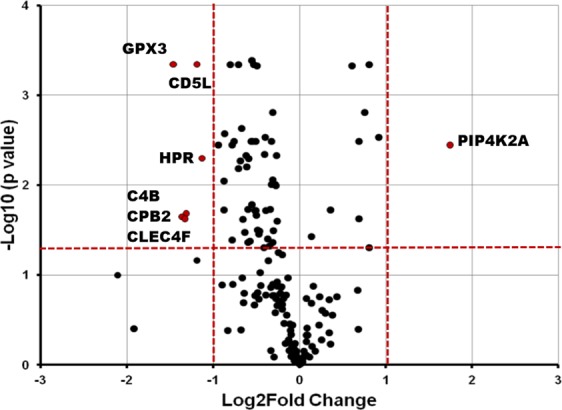
Figure 3.

Volcano Plot. X-axis is the Log2 of linear fold change (IPF/Controls) and Y-axis is the negative Log10 of the Benjamini-Hochberg corrected t-test p value. Vertical red dashed lines denote a linear fold change of 2 in either direction (IPF/Controls or Controls/IPF). Horizontal red dashed line denotes a cutoff of 0.05 for the FDR corrected p value. Any protein which falls to the left or right of vertical red dashed lines and above horizontal red dashed line (p value <0.05) is deemed to be significant different between the groups.
