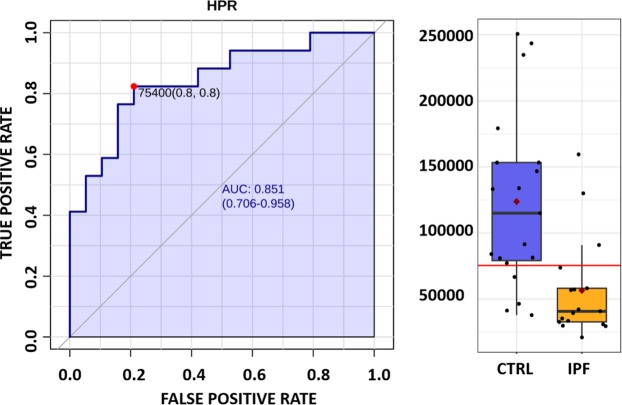
Figure 4.
Receiver operating characteristics curve analysis of Haptoglobin-related protein to differentiate idiopathic pulmonary fibrosis (IPF) from controls. Sensitivity (Y-axis) is plotted against 1-specificity for haptoglobin-related protein (Uniprot Accession: P00739) to differentiate between IPF and controls. Area under the curve value is shown on the ROC curve together with 95% confidence interval. At cutoff of 75400 (normalized abundance level), 80% of sensitivity and 80% of specificity was achieved. At right side of ROC curve, a box plot is shown to compare the two groups with individual samples shown as empty circles for cases (IPF) and black filled circles for controls.

