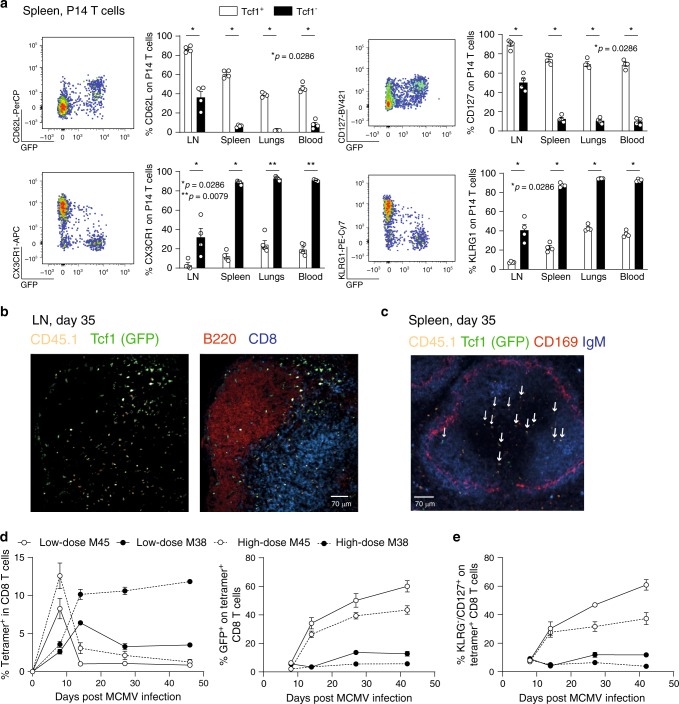
Fig. 2. Tcf1+ cells express markers associated with a central memory phenotype.
a CD45.1+ Tcf7GFP P14 cells were adoptively transferred into WT mice that were subsequently infected with 2 × 10⁵ PFU MCMV-ie2-GP33. Representative flow cytometry plots show the expression of GFP (Tcf1) and the indicated cell surface markers on P14 T cells in the spleen in latent MCMV infection. Bar graphs show the percentage of Tcf1+ (GFP+) and Tcf1− (GFP−) P14 cells expressing the indicated cell surface markers. All bar graphs represent mean ± SEM and each dot represents an individual mouse (n = 4–5). b Immunofluorescence staining of an inguinal LN section is shown 5 weeks post MCMV-ie2-GP33 infection with CD45.1 (P14 T cells) (orange), GFP representing Tcf1 (green), B220 (red) and CD8 T cells (blue). Scale bar is 70 µm. Section is representative of three individual mice. c Immunofluorescence staining of a splenic section is shown 5 weeks post MCMV-ie2-GP33 infection with CD45.1 (P14 T cells) (orange), GFP representing Tcf1 (green), CD169 (red) and IgM (blue). Scale bar is 70 µm. Arrows indicate Tcf1+ cells determined by GFP expression. Section is representative of three individual mice. d Tcf7GFP mice were infected with a low (103 PFU) or a high (106 PFU) dose of MCMVΔm157. The percentage of M45- and M38-specific CD8 T cells, determined by MHC Class I tetramer binding (left graph) and the percentage of tetramer+ CD8 T cells expressing GFP (right graph) is shown in the blood as mean ± SEM (n = 4). e The percentage of tetramer+ CD8 T cells expressing CD127 in the blood is shown as mean ± SEM (n = 4). a–e One experiment out of 2 or 3 independent experiments is shown (n = 3–5 mice). *p < 0.05, **p < 0.01; statistical significance was determined using the two-sided non-parametric Mann–Whitney test. Source data are provided as a Source Data File.

