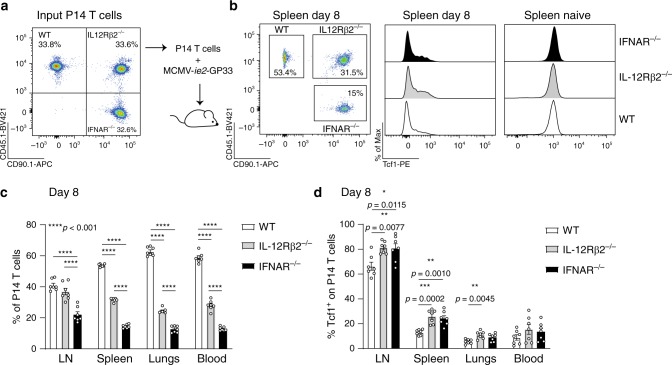
Fig. 3. Type I IFNs and IL12 regulate Tcf1 expression in MCMV-specific CD8 T cells.
a Experimental setup: equal numbers of CD45.1+ WT, CD45.1+CD90.1+ IL12Rβ2−/− and CD90.1+ IFNAR−/− P14 T cells, in total 104 cells, were adoptively transferred into the same hosts that were subsequently infected with 2 × 10⁵ PFU MCMV-ie2-GP33. Representative flow cytometric plot shows the portion of WT, IL12Rβ2−/− and IFNAR−/− P14 T cells in the mix that was initially injected into the mice. b Representative flow cytometric plot shows the portion of WT, IL12Rβ2−/− and IFNAR−/− P14 T cells in the spleen 8 days post-infection. Histogram shows the expression of Tcf1 (by intracellular staining) in the distinct P14 T cells. c The percentage of WT, IL12Rβ2−/− and IFNAR−/− P14 T cells in the total transgenic T cell pool is shown (n = 7). d Percentage of P14 T cells that expresses Tcf1 is shown (n = 7). All bar graphs represent mean ± SEM and each dot represents an individual mouse shown from pooled data of two independent experiments (n = 3–4 mice). *p < 0.05, **p < 0.01, ***p < 0.001 ****p < 0.0001; statistical analyses were performed using one-way ANOVA followed by Tukey’s multiple comparisons test. Source data are provided as a Source Data File.

