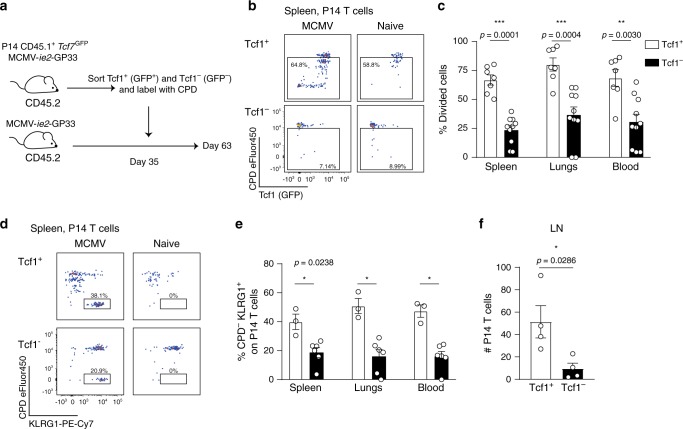
Fig. 4. Tcf1+ cells have proliferative capacity and give rise to Tcf1− KLRG1+ cells.
a Experimental setup: Tcf7GFP P14 T cells were adoptively transferred into CD45.2+ mice that were subsequently i.v. infected with 2 × 10⁵ PFU MCMV-ie2-GP33. After 5 weeks, Tcf1+ and Tcf1− P14 cells were sorted based on GFP, subsequently labelled with a cell proliferation dye and 5 × 10⁴ P14 T cells were adoptively transferred into infection-matched recipients. Naïve hosts received 1 × 10⁵ P14 T cells. Four weeks post adoptive transfer, the proliferation profile of the P14 T cells was determined. b Representative flow cytometry plot shows the proliferation history based on CPD dilution versus Tcf1 expression indicated by GFP on P14 T cells in the spleen. c The percentage of P14 cells in the spleen, blood and lungs that have proliferated at least once based on their CPD dilution, 28 days after adoptive transfer, is shown. Pooled data from two experiments are shown (n = 7–10). d Representative flow cytometry plot shows the proliferation history based on CPD dilution versus KLRG1 expression on P14 T cells in the spleen (n = 3–6). e The percentage of P14 cells that has out-diluted the CPD and expresses KLRG1 is shown. f The total number of P14 T cells in the LN is shown (n = 4). All bar graphs represent mean ± SEM, each dot represents an individual mouse. Data are representative from three independent experiments (n = 3–6 mice). *p < 0.05, **p < 0.01, ***p < 0.001; statistical significance was determined using the two-sided non-parametric Mann–Whitney test. Source data are provided as a Source Data File. .

