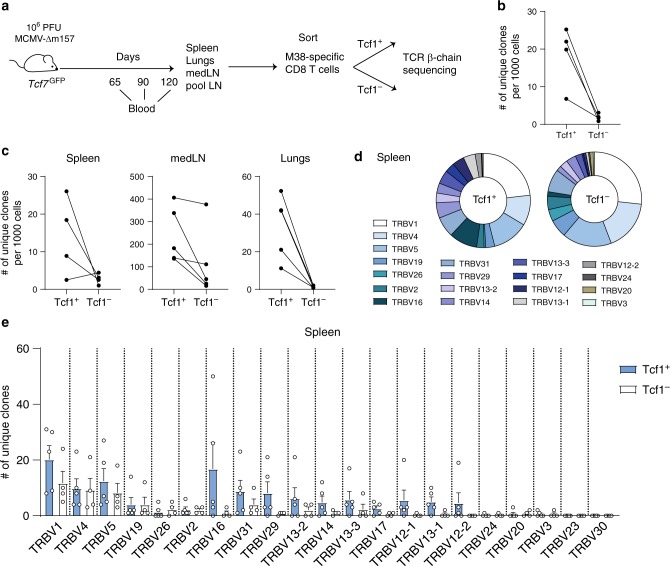
Fig. 6. M38-specific Tcf1+ cells have a larger clonal diversity than the Tcf1− cells.
a Experimental setup: Tcf7GFP mice were i.v. infected with 106 PFU MCMV-Δm157. At indicated times blood was collected. At the terminal timepoint, Tcf1+ and Tcf1− cells were sorted from the M38-specific population isolated from spleen, lungs and LNs, and the TCR-Vβ chain repertoire was determined by next generation sequencing. b The number of unique clones, determined by unique amino acid sequence of the CDR3, per 1000 cells is shown for the Tcf1+ and the Tcf1− M38-specific population. Each line indicates an individual mouse and lines connect data from the same mouse (n = 4). c The number of unique clones per 1000 cells is shown for the Tcf1+ and the Tcf1− M38-specific population in spleen, mediastinal LN and the lung. Each line indicates an individual mouse and lines connect data from the same mouse (n = 4–5). d Pie charts indicate the composition of the M38-specific population, where each colour represents the percentage of clones that uses a specific TCR V-β-gene in the spleen at day 120 post-infection. Data show average percentage with n = 5 mice (Tcf1+) and n = 4 (Tcf1−). e Bar graphs represents the total number of unique clones, determined by unique amino acid sequence of the CDR3, that is found within each TCR V-β-gene in the spleen at day 120 post-infection. Data represent mean + SEM with n = 4 or 5 mice per group from one experiment. Source data are provided as a Source Data File.

