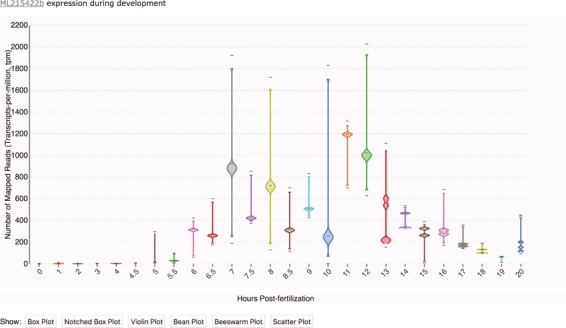
Figure 1.

Transcriptomic data displayed as a time-course distribution plot for gene ML215422b. Time-course distribution plots can be accessed through the ‘Temporal Developmental Expression Profile’ link on the MGP Portal home page. The expression profiles can be rendered in a variety of formats by clicking on the buttons immediately below the plot. Here, the profile is visualized as a bean plot.
