
Figure 6.
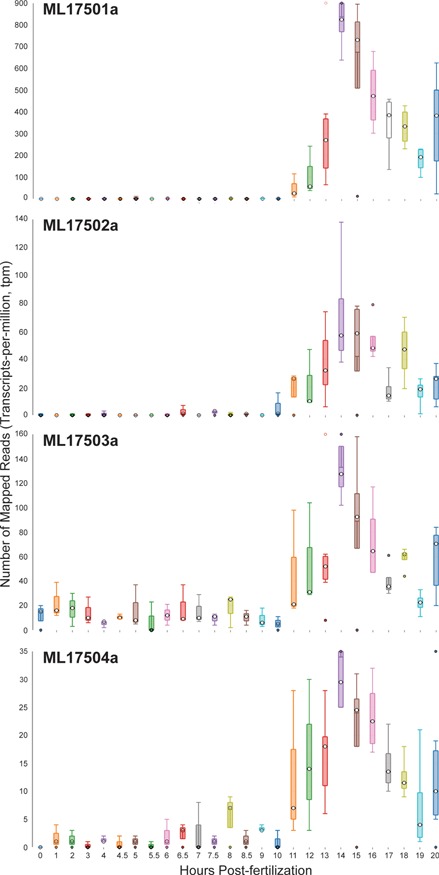
Time-course distribution plots for each of the four Mnemiopsis Group 1 collagen IV genes (ML17501a, ML17502a, ML17503a and ML17504a) generated by searching the gene identifiers on the ‘Temporal Developmental Expression Profiles’ page. Each profile image depicts the gene expression during embryonic development for a single Mnemiopsis gene plotting the number of mapped reads (transcripts-per-million, tpm) from 0 to 20 hpf. Temporal developmental profiles show expression at specific and consistent times across the collagen IV gene cluster with a single-mode curve starting at Hour 11, peaking at Hour 14, and steadily decreasing down through Hour 20. This expression pattern is consistent with the embryonic developmental stage for tentacle growth in Mnemiopsis leidyi.