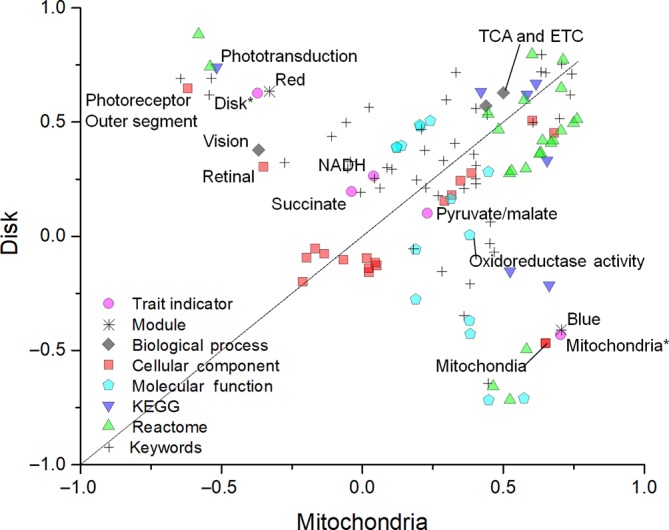
Figure 3.

Gene ontology annotation enrichment analysis. Plot shows the enriched signatures in disk and mitochondrial samples. In the graph, the points located on the straight line drawn through the coordinates (1x, 1y) and (−1x, −1y) represent the equally enriched signatures; those above or under this line are positively enriched in disk or mitochondria, respectively. Disks are enriched in proteins involved in vision/phototransduction processes, TCA cycle/ETC, and pathways localized in the photoreceptor OS. By contrast, mitochondria are enriched in specific proteins that characterize this organelle, in particular those involved in oxidoreduction (detailed in Table S2). ETC, electron transfer chain; NADH, reduced β‐nicotinamide adenine dinucleotide; OS, outer segment; TCA, tricarboxylic acid cycle
