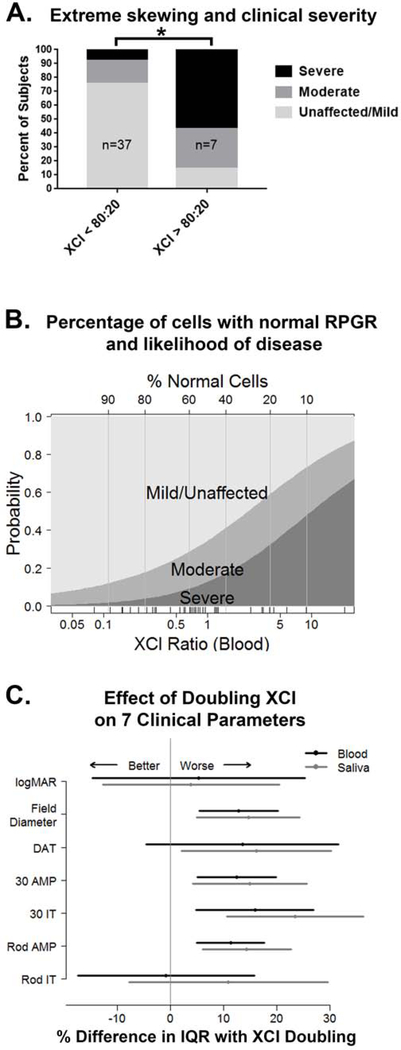
Figure 3. XCI ratio is associated with clinical severity.
A) Extreme skewing of the XCI ratio towards inactivation of the normal RPGR allele is associated with the severe phenotype (*p= 0.002). B) The probability of being mildly, moderately, or severely affected is plotted using multinomial regression as a function of the percent of cells with normal RPGR, inferred from the XCI ratio. The vertical distance represents the probability of each disease severity category for a specific XCI blood ratio. C) The change in each clinical parameter as the XCI ratio doubles is graphed as a percentage of the interquartile range (IQR) to normalize data from different scales, and in some cases the direction is reversed so that larger values indicate worse visual function. DAT= dark adaptation threshold, AMP= amplitude, IT= implicit time.

