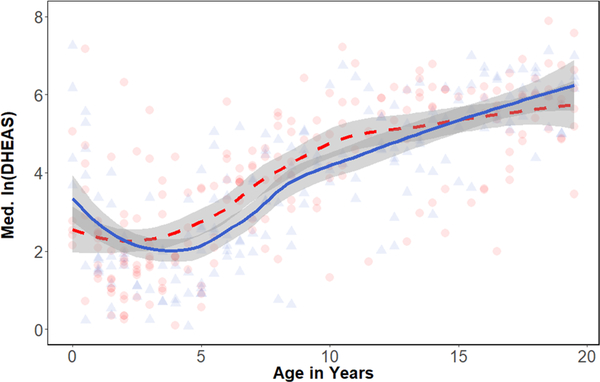
FIGURE 1.
Scatterplot and loess regression of DHEAS concentrations with age (in years) in females (n = 31) and males (n = 21). Each point represents an individual during a given 6-month age bin. Females are shown in red, circles, and dashed line. Males are shown in blue, triangles, and solid line. DHEAS, dehydroepiandrosterone-sulfate

